Dynamic Grouping of crosstab in BIRT
Source:
https://forums.opentext.com/forums/discussion/173783/dynamic-grouping-of-crosstab-in-birt#latest
In business filling-in, sometimes it is necessary to make dynamic grouping of crosstab statistics based on time interval, and realize dynamic grouping by day, week, month and year according to the length of time interval. For example, according to business needs, an enterprise needs to achieve order statistics in a period of time according to two parameters (start date, end date). The statistical rules are as follows:
Example: Calculate the difference between dates based on the input parameter values.
Var diff = end date - start date ----- days apart
If(diff <15)
Grouping “date group” to display dates
If(diff>15)
Grouping “date group” to display weeks
If(diff >30)
Grouping “date group” to display months
If(diff>365)
Grouping “date group” to display years
Are the little buddies a little overwhelmed? The above problem is essentially a problem of data preparation, but the way of code in SQL or scripted data sources is hard to write and heavy workload; the way of hiding columns in reports is neither universal nor straightforward. A better solution, then, is to introduce esProc into the reporting tool, which will make it easy to solve all kinds of problems. Next, we will take Birt Reporting Tool as an example to introduce the implementation process. For other reporting tools, they are similar.
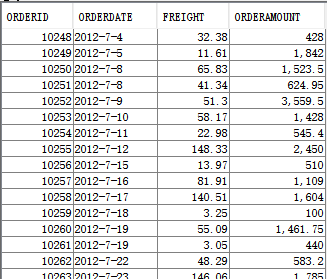
In this case, according to the input parameters, the total number of orders, freight charges and order amounts of enterprises from 2012-07-04 to 2014-05-06 are counted. The original data in the table "ORDERS" is as follows:
Let's look directly at esProc's SPL code to solve this problem:
A |
B |
C |
|
1 |
=connect("demo") |
// Connect the database |
|
2 |
=A1.query("select ORDERID,ORDERDATE,FREIGHT,ORDERAMOUNT |
//Query the order data between the start date and the end date from ORDERS table. StartDate and endDate are the date parameters. |
|
3 |
=interval(startDate,endDate) |
// Calculate the number of days between the start and end dates. |
|
4 |
if A3>365 |
// If the interval of days is greater than 365 days, the groups are grouped by year. |
|
5 |
=startDate|A3.(elapse@y(startDate,~)) |
// Calculate the grouping table by year |
|
6 |
=A2.group(B5.pseg(ORDERDATE); |
// Group A2 according to B5 interval, and count the total number of orders, freight charges and order amount, keep two decimal numbers, and B5 as the last column. |
|
7 |
=B6.new(BeginDate:BeginDate,#2:TotalOrder, |
// Take out the required data columns and generate a new result table. |
|
8 |
>A1.close() |
//Close the database |
|
9 |
return B7 |
// Return the result set grouped by year |
|
10 |
else if A3>30 |
// If the interval between days is greater than 30 days and less than or equal to 365 days, the groups are grouped by month. |
|
11 |
=startDate|A3.(elapse@m(startDate,~)) |
// Calculate the monthly grouping table |
|
12 |
=A2.group(B11.pseg(ORDERDATE); |
// Group A2 according to B11 interval, and count the total number of orders, freight charges and order amount, keep two decimal numbers, and B11 as the last column. |
|
13 |
=B12.new(BeginDate:BeginDate,#2:TotalOrder, |
||
14 |
>A1.close() |
||
15 |
return B13 |
// Return the result set grouped by month |
|
16 |
else if A3>15 |
// If the interval between days is greater than 15 days and less than or equal to 30 days, the groups are grouped by week. |
|
17 |
=startDate|A3.(elapse(startDate,7*~)) |
// Calculate the weekly grouping table |
|
18 |
=A2.group(B17.pseg(ORDERDATE); |
// Group A2 according to B17 interval, and count the total number of orders, freight charges and order amount, keep two decimal numbers, and B17 as the last column. |
|
19 |
=B18.new(BeginDate:BeginDate,#2:TotalOrder, |
||
20 |
>A1.close() |
||
21 |
return B19 |
// Return the result set grouped by week |
|
22 |
else |
// If the interval between days is less than 15 days, the groups are grouped by date. |
|
23 |
=startDate|A3.(elapse(startDate,~)) |
// Calculate the grouping table by date |
|
24 |
=A2.group(B23.pseg(ORDERDATE); |
// Group A2 according to B23 interval, and count the total number of orders, freight charges and order amount. Keep two decimal numbers, and take B23 as the last column. |
|
25 |
=B24.new(BeginDate:BeginDate,#2:TotalOrder, |
||
26 |
>A1.close() |
||
27 |
return B25 |
// Return the result set grouped by date |
|
The esProc SPL code is stored as order.dfx file and then introduced into the Birt report. Please refer to Qian College article 《How to Call an SPL Script in BIRT》for details.
Design a table in BIRT report is as follows:
![]()
Report calls esProc in exactly the same way as calling stored procedures. For example, in BIRT's stored procedure dataset, call orders (?,?) can be used to call them.
Next, let's take a look at the results of the WEB preview by entering different parameters:
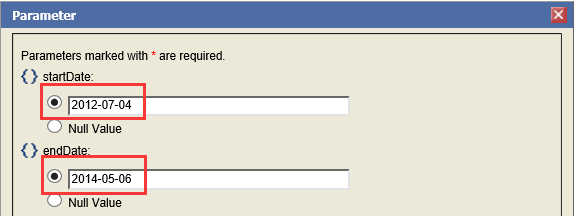
(1) Input parameters: start time 2012-07-04, end time 2014-05-06 The interval days are more than 365, and the groups are displayed according to year.

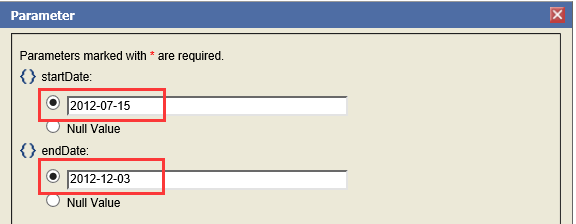
(2)Input parameters: start time 2012-07-15, end time 2012-12-03 The interval days are more than 30, and the groups are displayed by month.

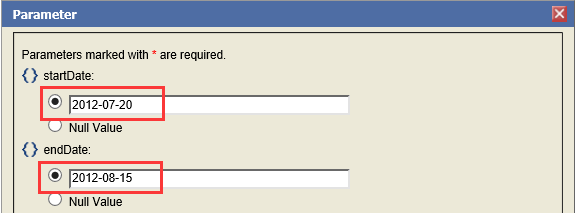
(3)Input parameters: start time 2012-07-20, end time 2012-08-15 The interval days are more than 15, and the groups are displayed by week.

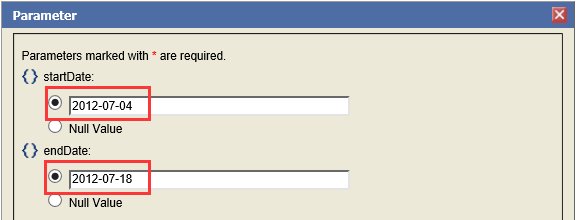
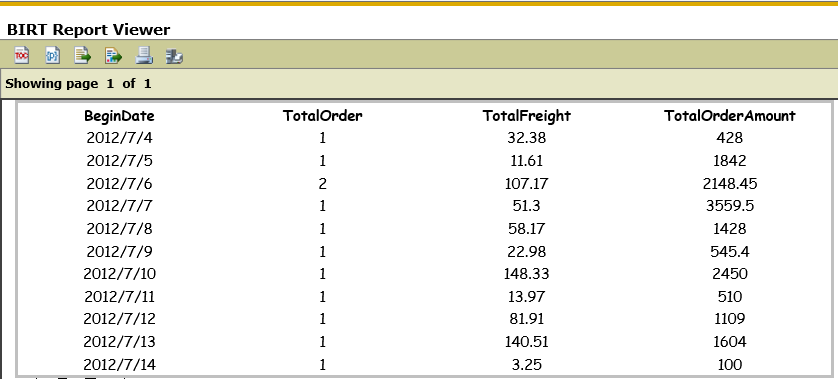
(4)Input parameters: start time 2012-07-04, end time 2012-07-18 The interval days are less than 15, and the groups are displayed by date.
SPL Official Website 👉 https://www.scudata.com
SPL Feedback and Help 👉 https://www.reddit.com/r/esProcSPL
SPL Learning Material 👉 https://c.scudata.com
SPL Source Code and Package 👉 https://github.com/SPLWare/esProc
Discord 👉 https://discord.gg/cFTcUNs7
Youtube 👉 https://www.youtube.com/@esProc_SPL


