Horizontally Extended Data Presentation
【Question】
I am new to BIRT. I am trying to display my BIRT report data from left to right horizontally. By default, table data fills vertically. But I would like to have exactly opposite to it.
My Dataset:
student_name
student_1
student_2
student_3
My expected result:
student_name student_1 student_2 student_3
How can I show data horizontally in BIRT?
【Answer】
BIRT presents data vertically. To present column groups horizontally, you have to turn to report script with complicated code. It’s much easier to prepare data source first in SPL (Structured Process Language) and then return the result to the reporting tool. For example, to have 3 column groups, you can use the following SPL script:
| A |
|
| 1 |
=myDB1.query("select EId,Name,Dept from emp") |
| 2 |
= A1.step(3,1) |
| 3 |
=A1.step(3,2)|[null] |
| 4 |
=A1.step(3,3)|[null] |
| 5 |
=A2.derive(A3(#).EID:EId2,A3(#).NAME:Name2,A3(#).DEPT:Dept2,A4(#).EID:EId3,A4(#).NAME:Name3,A4(#).DEPT:Dept3) |
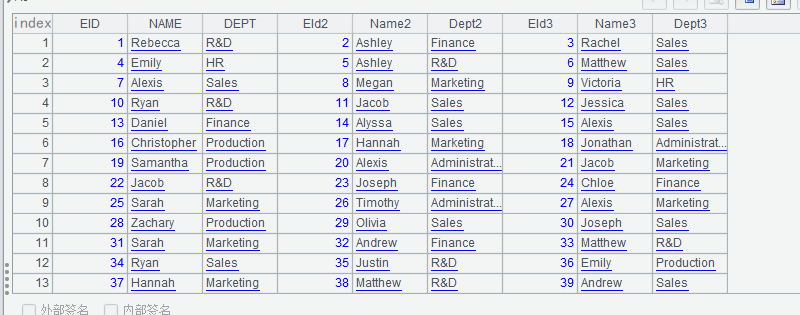
Result:

A1: Retrieve data needed.
A2: Divide data into 3 segments, and get the first one to generate a new sequence.
A3: Get the second one to generate a new sequence.
A4: Get the third one to generate a new sequence.
A5: Extend A2’s fields two times and populate A3 and A4’s data under them row by row to generate a new table sequence.
You can connect to esProc from BIRT via JDBC and call an SPL script the same way as calling a stored procedure. For details, see How to Call an SPL Script in BIRT.
SPL Official Website 👉 https://www.scudata.com
SPL Feedback and Help 👉 https://www.reddit.com/r/esProc_SPL
SPL Learning Material 👉 https://c.scudata.com
SPL Source Code and Package 👉 https://github.com/SPLWare/esProc
Discord 👉 https://discord.gg/cFTcUNs7
Youtube 👉 https://www.youtube.com/@esProc_SPL


