Aggregate Rows and Columns by Segments
【Question】
I have a report to do and I’m hopeless.
I need a grid or table with empirica_score as rows (DISTINCT) and mfin_score as columns. (DISTINCT) E.g.
Then I need to divide the total paysoft_result records per customer with the total NAEDO records per customer where start_date is DISTINCT.
times * 100 to get percentage.
This calculated value needs to be placed on the grid in the correct emprica_score mfin_score location on the grid.
I don’t even know how or where to start.
【Answer】
Both rows and columns of the cross table contain ranges and measures come from another table. You can prepare report data source with esProc. First you create segmental ranges for rows and columns, divide the total records count by the total customer count over the two tables holding foreign keys, and populate the aggregate results into the grid.
Below is the esProc SPL (Structured Process Language) script:
| A |
|
| 1 |
=[560,575,585,595,605,615,625,635,645,655,665] |
| 2 |
=[39,66,91,116,137,155] |
| 3 |
=connect(“test”) |
| 4 |
>account_detail=A3.query(“select * from account_detail where empirica_score >= ? and mfin_score >= ?”,“560”,“39”) |
| 5 |
>paysoft_result=A3.query(“select * from paysoft_result”) |
| 6 |
>NAEDO=A3.query("select start_date,cust_code from naedo") |
| 7 |
=account_detail.new(account_no,A1.pseg(empirica_score):row,A2.pseg(mfin_score):col,paysoft_result.count(custno==account_no):pcount,NAEDO.count(cust_code==account_no):ncount) |
| 8 |
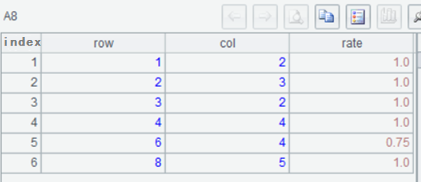
=A7.group(row,col;~.sum(pcount)/~.sum(ncount):rate) |
A1, A2: Define segmental ranges.
A3: Connect to test database.
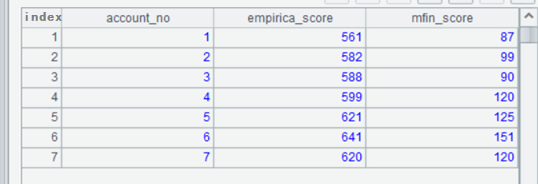
A4: Read in data from account_detail table as a table sequence, get records where empirica_score and mfin_score are above the smallest specified values, and store them as the object account_detail.
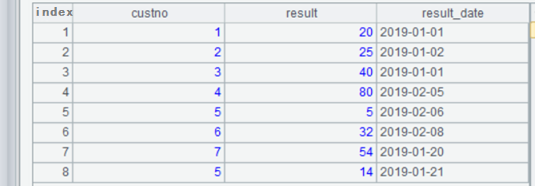
A5: Read in data from paysoft_result table and return it as the object paysoft_result.
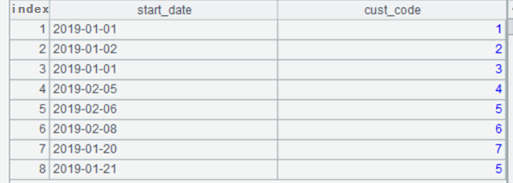
A6: Read in data from NAEDO table and return it as the object NAEDO.
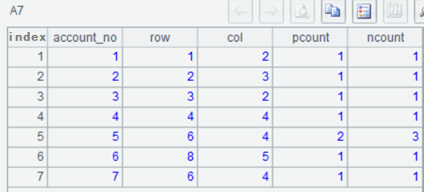
A7: Find the row and column where each account will settle in the result table, and count the frequency of each count in paysoft_result table and NAEDO table.
A8: Group A7’s table by row and column and calculate the rate.
account_detail object:
paysoft_result object:
NAEDO object (distinct start_date):
A7
A8
SPL Official Website 👉 https://www.scudata.com
SPL Feedback and Help 👉 https://www.reddit.com/r/esProcSPL
SPL Learning Material 👉 https://c.scudata.com
SPL Source Code and Package 👉 https://github.com/SPLWare/esProc
Discord 👉 https://discord.gg/2bkGwqTj
Youtube 👉 https://www.youtube.com/@esProc_SPL


