Open-source SPL Helps BIRT to Achieve Difficult Reports
BIRT is a popular open-source reporting tool. It is convenient for report development with its independent IDE and wizard and rich functionalities. But it has difficulty in handling reports with complex and special formats. The major reason for this is its weak data preparation ability. BIRT scripted data set is not nearly as good as the specialized data processing engine. Often hardcoding is needed for developing complex reports, making the process very complicated.
The open-source esProc SPL can make a professional and excellent partner. SPL is a specialized structured data computing engine. It offers rich class libraries, all-around, database-independent computational capability, the ability to access diverse/multiple data sources and perform mixed computation between them. Its agile syntax enables fast data preparation, and moreover, it has many high-performance mechanisms to ensure efficient report execution. All these will make SPL an exceptional teammate BIRT can have.
Here are examples of SPL helping BIRT to handle difficult reports.
Reports with special layouts
Multicolumn report with row-wise layout
BIRT only supports printing data column-wise in multi-column layout. It is extremely hard to print data row-wise in a multi-column manner, like the following figure shows, where we want to create the report on the right according to the data set on the left:
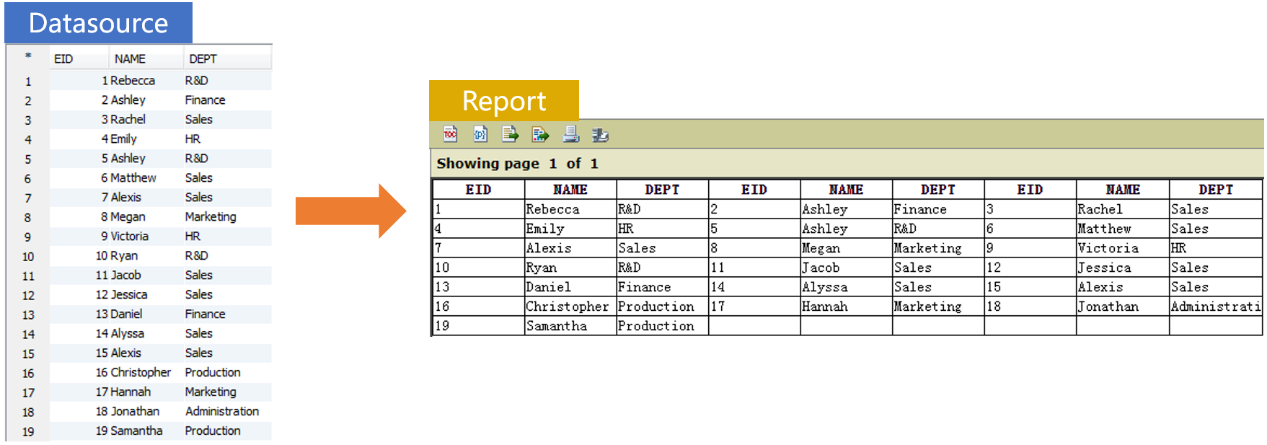
In such cases we can use SPL to prepare the data source and send the desired form to BIRT for presentation.
A |
B |
|
1 |
=connect(“db”) |
/Connect to database |
2 |
=A1.query@x("SELECT EID, NAME, DEPT FROM EMPLOYEE") |
/Execute SQL to retrieve data |
3 |
=create(EID,NAME,DEPT,EID2,NAME2,DEPT2,EID3,NAME3,DEPT3) .record(A2.conj(~.array())) |
/Create result set and populate data row by row |
Below is the prepared data set (A3) that BIRT can use directly:

Multicolumn report with interlocking row-wise layout
Similarly, it is convenient to use SPL to achieve an interlocking printout, as shown below:
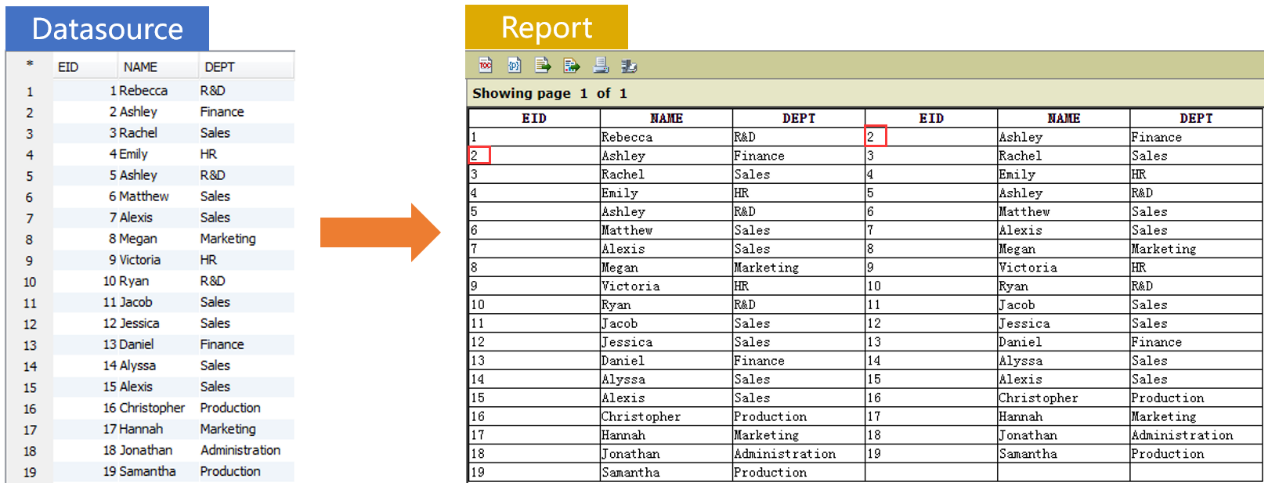
Prepare the data source in SPL:
A |
B |
|
1 |
=connect("db") |
|
2 |
=A1.query@x("SELECT EID, NAME, DEPT FROM EMPLOYEE") |
|
3 |
=A2.derive(EID[1]:EID2,NAME[1]:NAME2,DEPT[1]:DEPT2) |
/Use the [1] method to get the next value in the computed column |
Multi-page report by row/column number for a wide table
We can achieve pagination by row number using a simple script in BIRT, but it is rather difficult to do this by column (field) number. Given a wide table stored in any database that cannot be wholly printed on one page, we are trying to create a report with the first N columns printed on the first page, columns from N+1 to 2N printed on the second page, and so on.
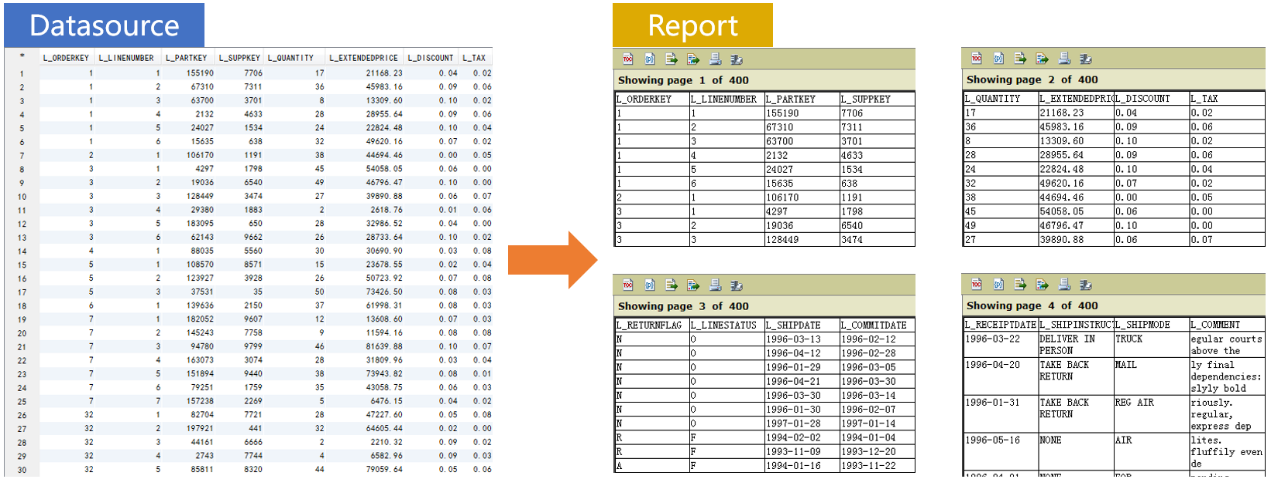
Prepare the data source in SPL:
A |
B |
|
1 |
=connect("demo") |
|
2 |
=A1.query@x("SELECT * FROM"+table) |
/Parameter table is the database table name passed in |
3 |
=create(${col.("col"/~).concat@c()}) |
/Dynamically generate an empty table where the number of columns is specified by col |
4 |
=A2.group((#-1)\row) |
/Group rows every specified number of rows (row) |
5 |
=A2.fname().group((#-1)\col) |
/Group field names by col |
6 |
=A5.("["+~.concat@cq()+"]|~.conj(["+~.concat@c()+"])").concat("|") |
/Assemble the string to be executed |
7 |
=A4.run(A3.record(${A6})) |
/Loop each group to assign values |
8 |
return A3 |
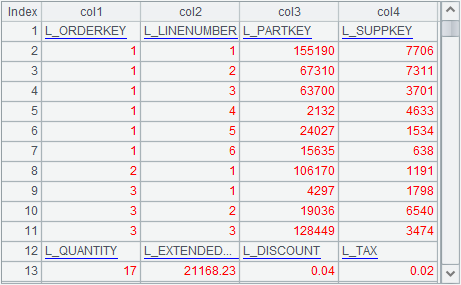
The above is A3’s result when col is 4 and row is 10. This is the data set the report needs. Just set pagination every row+1 rows for presentation.
Complex formats
Conditional format for each group
Let’s look at an example: group records by STATE, and if the current group has more than one record, precede NAME of each record with the plus sign (+) from the second record and add a row of SALARY subtotal at the end, as shown below:
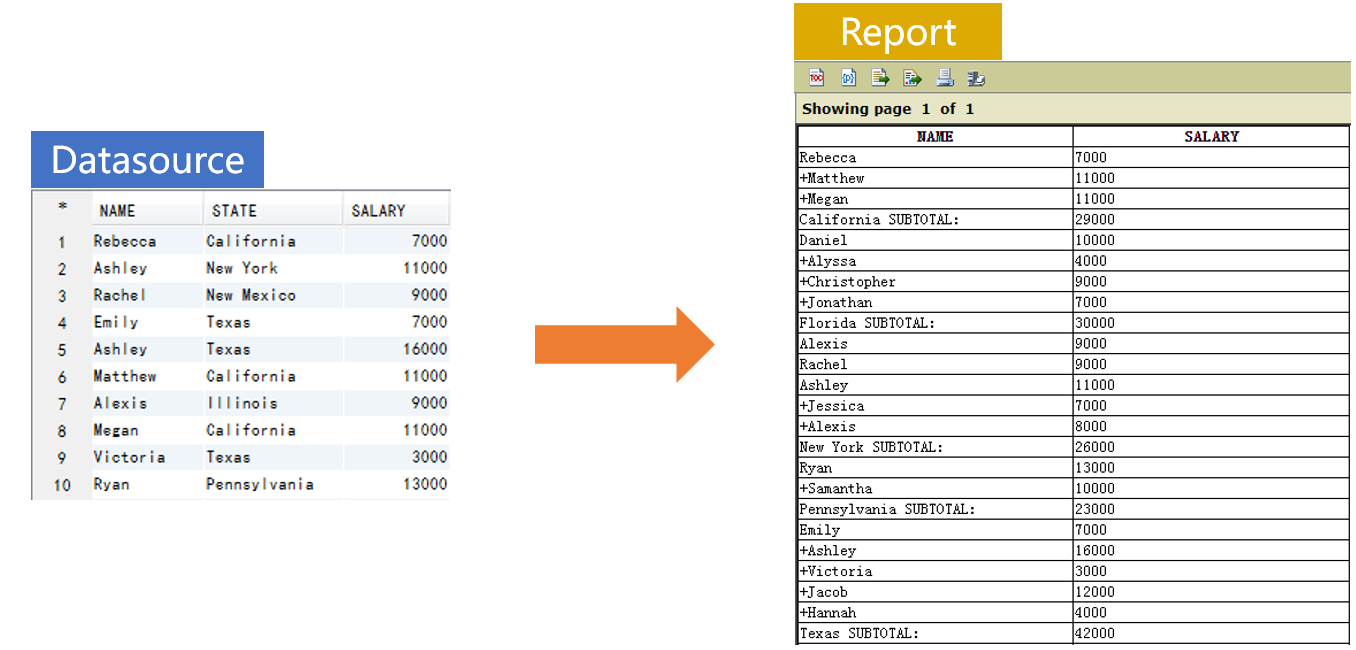
Prepare the data source in SPL:
A |
B |
|
1 |
=connect("demo") |
|
2 |
=A1.query@x("SELECT * FROM EMPLOYEE") |
|
3 |
=create(NAME,SALARY) |
|
4 |
for A2.group(STATE) |
>A3.insert(0:A4,if(#>1,"+")+NAME,SALARY) |
5 |
=if(A4.len()>1,A3.insert(0,A4.STATE+" SUBTOTAL:",A4.sum(SALARY))) |
|
6 |
return A3 |
Splitting field into records
Database table DATA has two fields. ANOMOALIES field contains tab-separated string values. We are trying to split each ANOMOALIES value into multiple strings by tab, and join up each substring with the original ID to generate new records.

Prepare the data source in SPL:
A |
B |
|
1 |
=connect("demo") |
|
2 |
=A1.query@x("SELECT * FROM DATA") |
|
3 |
=A2.news(ANOMALIES.split(" ");ID,~:ANOMALIES) |
/Split value by tab to generate new records |
Report with rows copied
Copy each of the rows three times in sequence and present the result with a report, as shown below:
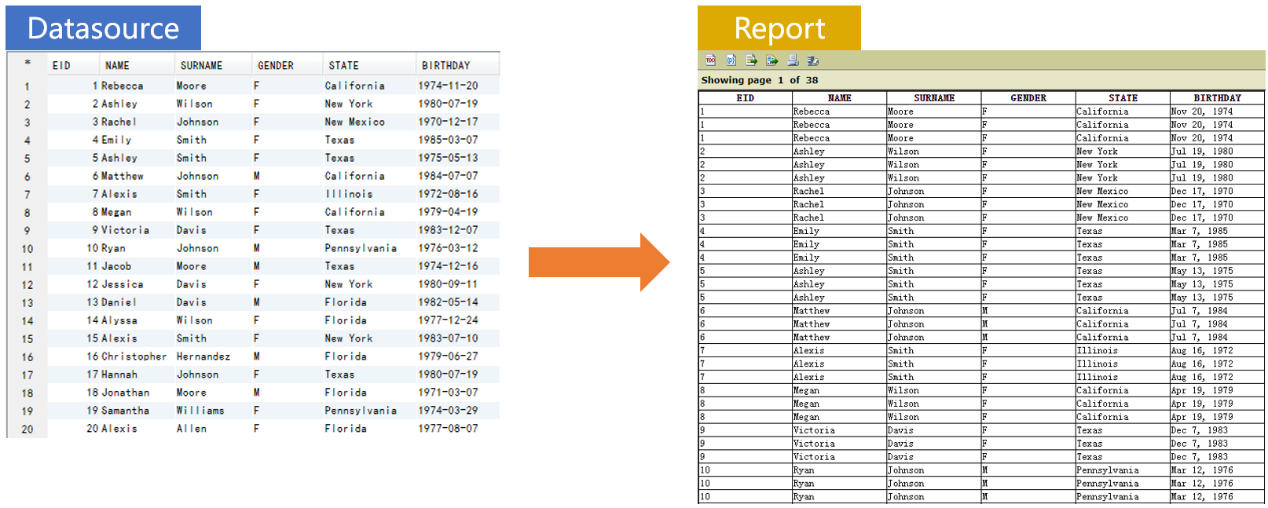
Prepare the data source in SPL:
A |
B |
|
1 |
=connect("demo") |
|
2 |
=A1.query@x("SELECT * FROM EMPLOYEE") |
|
3 |
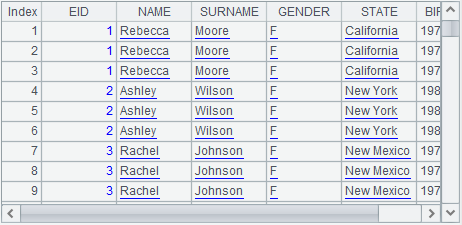
=A2.conj([~]*3) |
/Copy each record three times |
To get the desired layout:
Row-to-column/column-to-row transposition
The database table SALES stores orders data. We want to create a report where column headers are months and row headers are aggregates.

Prepare the data source in SPL:
A |
B |
|
1 |
=connect("demo") |
|
2 |
=A1.query@x("SELECT month(ORDERDATE) AS MONTH, sum(AMOUNT) AS OSUM, max(AMOUNT) AS OMAX, min(AMOUNT) AS OMIN, count(ORDERID) AS ONUM FROM SALES GROUP BY MONTH ORDER BY MONTH") |
|
3 |
=A2.pivot@r(MONTH;SUBTOTAL,VALUE) |
/Column-to-row transposition |
4 |
=A3.pivot(SUBTOTAL;MONTH,VALUE) |
/ Row-to-column transposition |
Irregular summarization
Inter-column calculation for crosstab
Database table STORE stores sales volumes of products in the year 2014 and 2015. We want to calculate each item’s sales volume in each year and their yearly growth rate, and present them in a report.

Prepare the data source in SPL:
A |
B |
|
1 |
=connect("demo") |
|
2 |
=A1.query@x("SELECT * FROM STORE ORDER BY ITEM, YEAR") |
|
3 |
=A2.group@o(ITEM).run(A2.record(["GROWTH RATE", ITEM, ~(2).QUANTITY/~(1).QUANTITY-1])) |
/Calculate growth rate for each item |
4 |
=A2.pivot(ITEM;YEAR,QUANTITY) |
/ Row-to-column transposition |
Summarization based on irregular division of months
Database table SALES stores orders data. We are trying to calculate the total sales in each month from 2013-01-16 to 2013-08-18 and present them in a report.

Prepare the data source in SPL:
A |
B |
|
1 |
=connect("demo") |
|
2 |
=A1.query@x("SELECT ORDERID, AMOUNT, ORDERDATE FROM SALES WHERE ORDERDATE>=? AND ORDERDATE < ? ORDER BY ORDERDATE",startDate,endDate) |
|
3 |
=interval@m(startDate,endDate) |
/Calculate how many months between start date and end state |
4 |
=startDate|A3.(elapse@m(startDate,~)) |
/Concatenate start date with new date |
5 |
=A2.group(A4.pseg(ORDERDATE):NUMBER;round(~.sum(AMOUNT),2):TOTALAMOUNT,A4(#):STARTDATE) |
Group by sequence numbers of date intervals, and get the start date in each group |
Inter-row calculation within group
Database table SAMPLE has three fields, among which ID is the grouping field. We are trying to design a report grouped by ID and where the detail data fields are V1, V2 and the computed column CROSSLINE. The algorithm of calculating CROSSLINE values is the sum of V1 and V2 in the current record plus the sum of V1 and V2 in the previous record of the same group.

Prepare the data source in SPL:
A |
B |
|
1 |
=connect("demo") |
|
2 |
=A1.query@x("SELECT ID, V1, V2 FROM SAMPLE ORDER BY ID") |
|
3 |
=A2.derive(iterate(~~+V1+V2;ID):CROSSLINE) |
/Add computed column CROSSLINE, whose value is the sum of current V1 and V2 plus that of the previous V1 and V2 in the same group |
Dynamic reports
Dynamic data source
The connection of data source is determined by a report parameter.
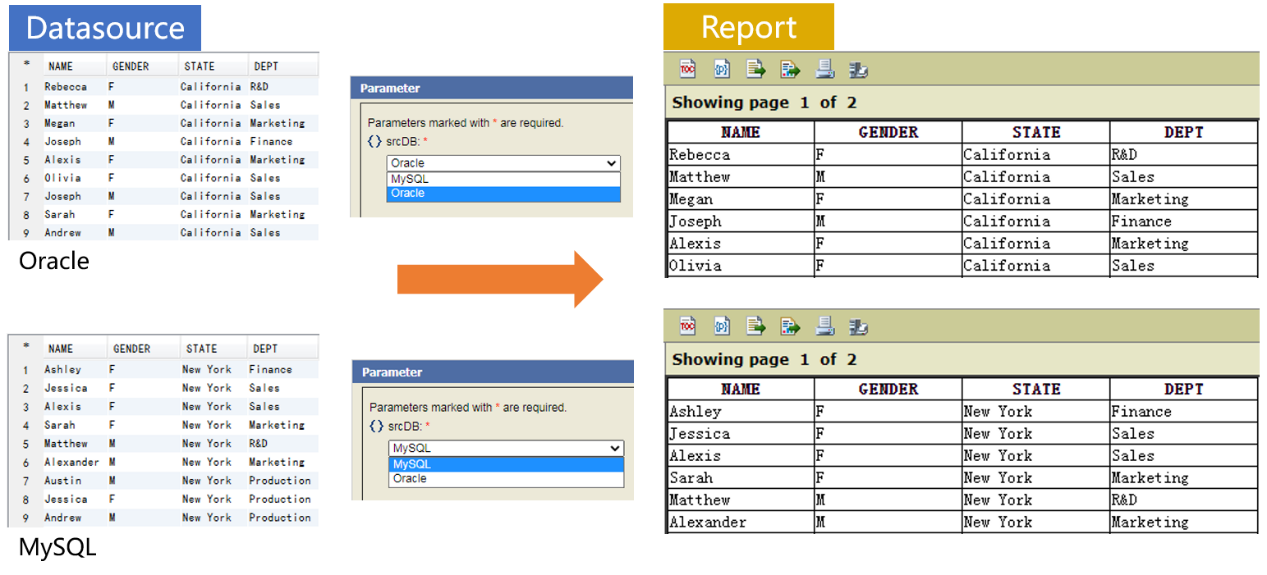
To connect data source and retrieve data in SPL:
A |
B |
|
1 |
=connect(srcDB) |
/ Parameter srcDB is name of database to be connected |
2 |
=A1.query@x("SELECT * FROM EMPLOYEE") |
/ Execute SQL to retrieve data |
Report based on cross-data-source join
We have a database table TABLE1 and the Excel file table2.xlsx. They have same structure. We are trying to group each of them by NAME, count records in each group (NUM1 and NUM2), sum VALUE in each group (AMOUNT1 and AMOUNT2), and present their results respectively in a report, as shown below:
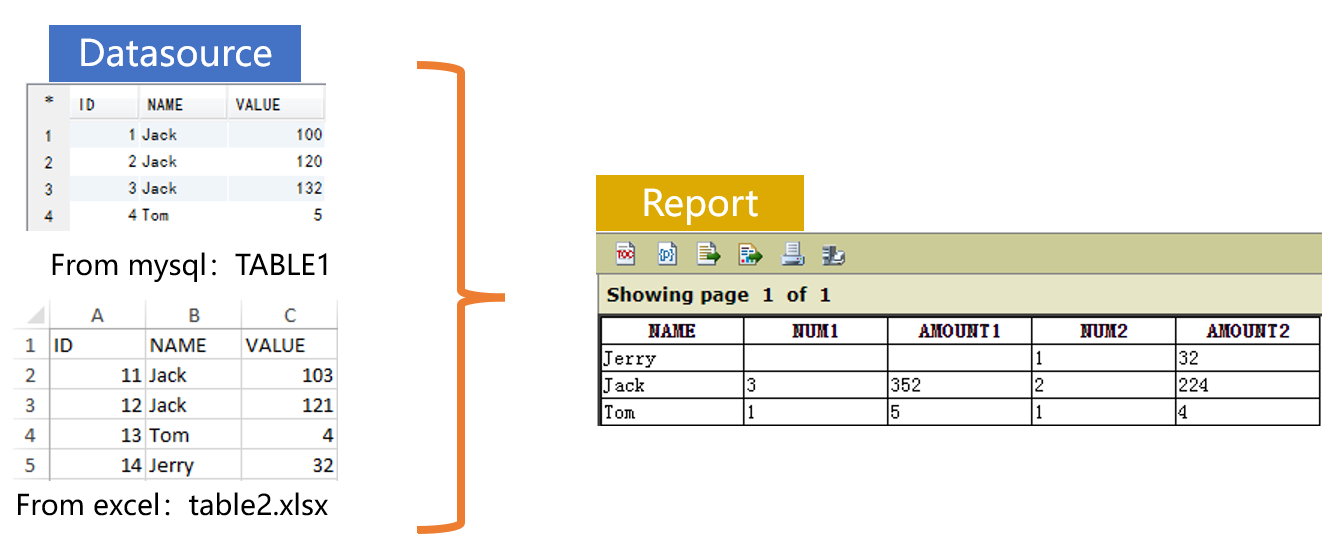
Prepare the data source in SPL:
A |
B |
|
1 |
=connect("demo") |
|
2 |
=A1.query@x("SELECT NAME, count(*) AS NUM, sum(VALUE) AS AMOUNT FROM TABLE1 GROUP BY NAME") |
/Get data from database |
3 |
=file("table2.xlsx").xlsimport@t() |
/Get data from Excel file |
4 |
=A3.groups@o(NAME;count(~):NUM,sum(VALUE):AMOUNT) |
/Group, count and sum |
5 |
=join@f(A2:T1,NAME;A4:T2,NAME) |
/Full join |
6 |
=A5.new(ifn(T1,T2).NAME:NAME,T1.NUM:NUM1,T1.AMOUNT:AMOUNT1, T2.NUM:NUM2,T2.AMOUNT:AMOUNT2) |
/List names, counts and sums for each of the two tables |
Report grouped by dynamic time unit
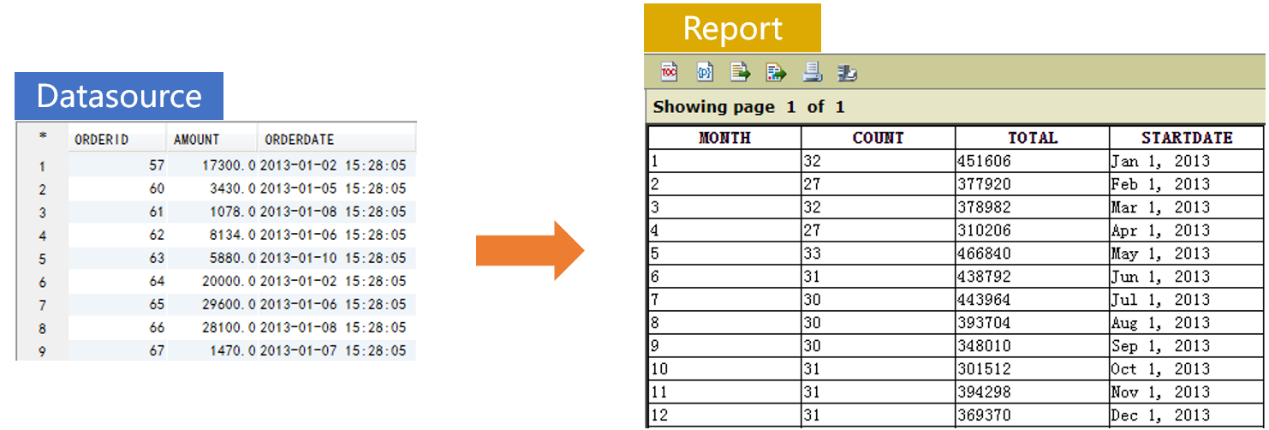
Prepare the data source in SPL:
A |
B |
C |
|
1 |
=connect("demo") |
||
2 |
=A1.query@x("SELECT ORDERID, ORDERDATE, AMOUNT FROM SALES WHERE ORDERDATE>=? AND ORDERDATE <= ?",sdate,edate) |
||
3 |
=interval(sdate,edate) |
/Calculate number of days between start date and end date |
|
4 |
if A3>365 |
>duration=sdate|A3.(elapse@y(sdate,~)),DN="YEAR" |
/Group by year if interval≥365 |
5 |
else if A3>30 |
>duration=sdate|A3.(elapse@m(sdate,~)),DN="MONTH" |
/Group by month if interval>30 & interval≤365 |
6 |
else if A3>15 |
>duration=sdate|A3.(elapse(sdate,~*7)),DN="WEEK" |
/Group by week if interval>15 & interval≤30 |
7 |
else |
>duration=sdate|A3.(elapse(sdate,~)),DN="DAY" |
/Group by day if interval≤15 |
8 |
=A2.group(duration.pseg(ORDERDATE):${DN};~.count(ORDERID):COUNT,round(~.sum(AMOUNT),2):TOTAL,duration(#):STARTDATE) |
/Group, count and sum |
Report based on IN condition query
BIRT gives poor support of array parameters, making it difficult to handle IN condition queries. SPL can help BIRT with this through its support for array parameters.

Prepare the data source in SPL:
A |
B |
|
1 |
=connect("demo") |
|
2 |
=A1.query@x("SELECT * FROM SALES WHERE ORDERID IN (?)",ids.split@c()) |
/Split an array by comma |
After examples of SPL’s powerful ability in helping BIRT with handling special or complex reports, let’s move on to look at how to integrate SPL into BIRT. This is easy through the standard JDBC driver encapsulated in SPL.
Integrating SPL into BIRT
SPL is Java-based. We just need to import necessary jars to integrate an SPL script into BIRT seamlessly. SPL offers the standard JDBC driver to be able to act as BIRT’s data source. The SPL script is invoked in the way of calling the stored procedure.
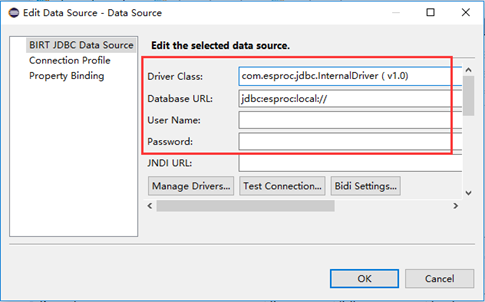

See How to Call an SPL Script in BIRT to learn more about the integration.
With SPL, there will be no reports that BIRT cannot handle conveniently. Open-source SPL plus open-source BIRT. That’s perfect match. Go get it now!
SPL Official Website 👉 https://www.scudata.com
SPL Feedback and Help 👉 https://www.reddit.com/r/esProcSPL
SPL Learning Material 👉 https://c.scudata.com
SPL Source Code and Package 👉 https://github.com/SPLWare/esProc
Discord 👉 https://discord.gg/2bkGwqTj
Youtube 👉 https://www.youtube.com/@esProc_SPL


Chinese version