The very tool to liberate an Excelman from working overtime - SPL
Excel is currently the most widely used software tool in the workplace, with a large number of “Excelmen” in various industries using it to draw tables and perform calculations. It can be said that without Excel, many work staff cannot work properly.
However, Excel is not perfect either. It basically lacks automatic processing capabilities, and its formula calculation ability is not strong enough, resulting in many daily tasks that can only be manually processed on Excel, with low efficiency. As a result, working overtime in Excel has become a common occurrence among many “Excelmen”.
Let’s take a look at how to liberate the Excelmen and make everyone leave work early.
Batch job
Sometimes we need to process batch Excel files, such as merging 100 Excel tables submitted by subordinate organizations or employees into one large file. Excel doesn’t provide any good methods, so you can only open, copy, and paste them one by one, and doing it dozens or hundreds of times can be exhausting.
If we simply need to put the tables together in order, it would still be a mechanical action. Although tiring, it doesn’t take too much effort. However, actual problems are always more complicated than expected. For example, these are common scenarios:
- When concatenating, it is necessary to add the file name, otherwise it is unknown where this line of data originally came from;
- Some tables have different column orders that need to be adjusted to align;
- There are duplicate data in certain tables that need to be identified and eliminated;
- …
In these cases, you have to stare at these grids when copying and pasting, it is not only laborious but also eye-exhausting, and you may have to wear an eye-glasses 300 degrees deeper when you finish and it is even impossible to finish work on time.
So what should we do?
Some may say, batch processing, then programming!
No problem, which language to use?
Some may say again, VBA!
Indeed, VBA has no problem doing these things in principle. It is also the programming language that comes with Excel and can be used without installation. However, VBA is too basic and does not provide much help for batch data processing. Any action requires writing a long and large section of code, which is not easy to solve the above problems.
Then what else is available?
There are countless training classes on the street that will tell you: Learn Python!
Python looks beautiful, but in reality, it’s completely different. To use it to assist Excel in data processing, you need to use a third-party program called Pandas. Let’s skip how difficult it is for non professional programmers to install Python and Pandas first. The key issue is that Pandas does not view data as a familiar table (a set of rows of data), but as a matrix. The related operations and functions often do not appear as you expected, making it difficult to understand. Moreover, there are N ways to express operations with the same function, which makes people confused and can only temporarily search for examples online. Coding correctly or incorrectly is often based on luck; Not to mention its debugging, since you can’t write the program right all at once. Python’s debugging functionality is not good, and Pandas is not native to Python, making debugging even more challenging.
Python is a good programming language, but it is not aimed at non professional programmers. Its users are all heavy professionals.
Python is not suitable, so what else is there?
SPL! SPL is probably the only programming language in the world that can be learned by non professional programmers in the workplace. For most data processing functions that Excel is not good at, it only requires one or two lines of code to solve.
For example, the issue of merging Excel mentioned earlier, if you want to merge all Excel files in a directory into one and convert the file name to a column value, simply write the following three lines of code:
| A | |
|---|---|
| 1 | =directory@p(“tmp/*.xlsx”) |
| 2 | =A1.conj((fn=filename@n(~),T(~).derive(fn:Commodity))) |
| 3 | =T(“Amount.xlsx”,A2) |
The different order of columns is also very simple:
| A | |
|---|---|
| 1 | =T(“FruitsPriceStock.xlsx”) |
| 2 | =T(“MeatsPriceStock.xlsx”) |
| 3 | =A1.insert@f(0:A2) |
| 4 | =T(“FoodsPriceStock.xlsx”,A3) |
Eliminating duplicate data is not a problem:
| A | |
|---|---|
| 1 | =T(“Customer1.xlsx”).sort(Name,Times) |
| 2 | =T(“Customer2.xlsx”).sort(Name,Times) |
| 3 | =[A1,A2].merge@u(Name,Times) |
| 4 | =T(“CustomerTimes.xlsx”,A3) |
Look, are these codes very simple!
Similarly, when there is a merge, there is a split. If you want to categorize an Excel file by a certain column, then split it into multiple files, manually copy and paste, and keep saving as another file, it can be very tiring, while SPL only requires a few lines:
| A | B | |
|---|---|---|
| 1 | =T(“orders.xlsx”) | =A1.group(Shippers) |
| 2 | for B1 | =T(A2.Shippers+“.xlsx”,A2) |
There is also the issue of converting batch Excel spreadsheets, such as converting such grade sheets:

to a crosstab:

One or two tables can be manually operated, and if the grades of eight, ten, or even dozens or even hundreds of classes on hand that need to be so converted, you can imagine how tiring it is. But as long as you know SPL programming, it’s just a matter of one or two lines.
Calculation within the table and format conversion
There are still many scenarios in daily work that involve calculation tasks in Excel spreadsheets. Excel itself provides formulas and operations that are not rich enough for certain complex needs, resulting in many manual actions.
We know that Excel can calculate against an area, which means it has the concept of a set. However, it cannot make the values of a cell a set, nor does it provide a function for the set. Therefore, operations involving set are very cumbersome, such as the following example:
Each column is a list of the top ten products in terms of sales (the number of months will increase over time):

Now we want to find out the list of products that have all entered the top ten in recent months, which is actually finding the intersection of several columns of data (the top ten list in several months). However, Excel does not directly provide this function, and can only handle it using data operations: select the list for January, use the condition range, and set the condition range to the list for February to obtain the intersection of the top ten lists in January and February. Next, use the intersection of January and February to find the intersection with March, repeat the above steps, operate the same number of times as the number of months, and finally obtain the intersection of all months.
If there is 12 months of data by the end of the year, following the above steps will drive people crazy ☹.
SPL can also be helpful in this case by providing a plugin. After installing it, Excel adds an additional function, and this operation can be completed with just one line:
=spl("=transpose(?1).isect()",B2:E11)
Select the cell in Excel where you want to store the results and write this formula to:

As there are more months, you only need to expand the area involved.
Excel’s text processing capabilities are also not very strong, such as the example of text splitting below (columns D and E have multiple lines of text, with the same number of lines and one to one correspondence, such as F corresponding to Fail):
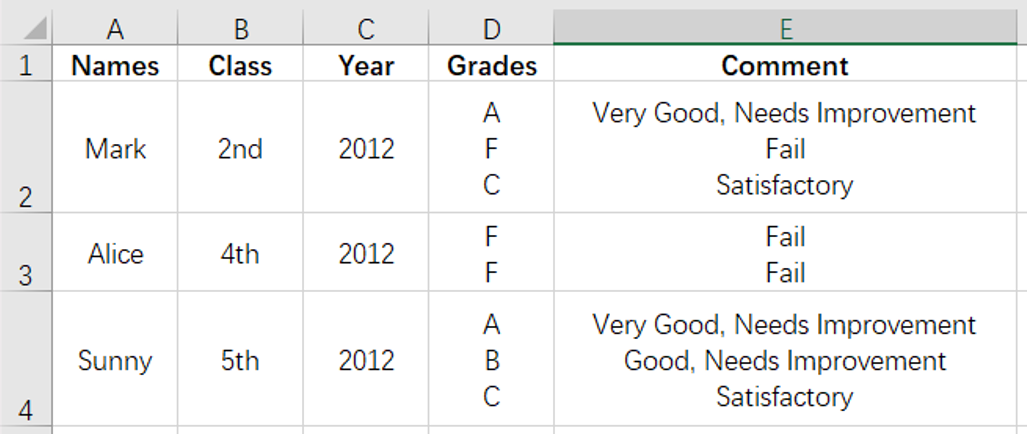
Now we need to split columns D and E into new rows and expand them into multiple rows. We hope the results are as follows:
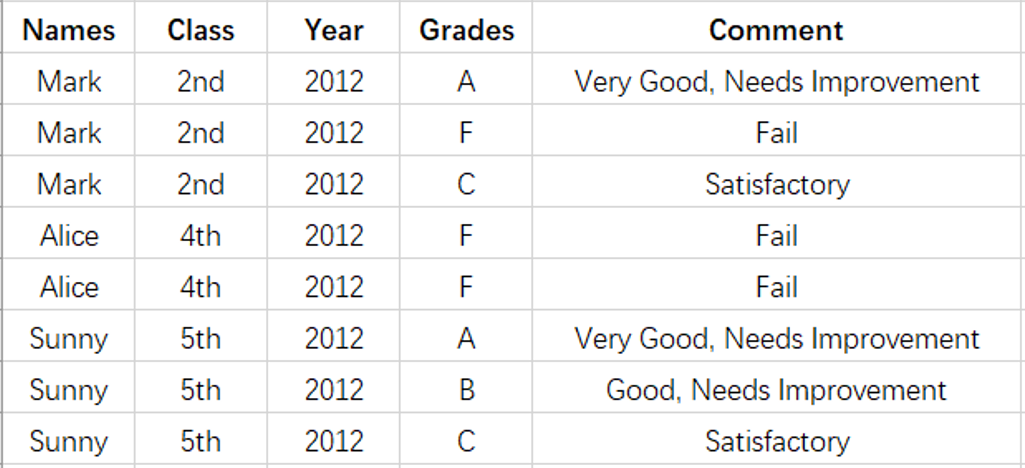
Excel has a column splitting function to split strings, but only the results can be split into multiple columns. Now we want to split into multiple rows and copy data from other columns at the same time. Excel can do it manually. But with SPL, it’s still a matter of one line:
=spl("=E(?1).run(Grades=Grades.split(""\n""),Comment=Comment.split(""\n"")).news(Grades.len();Names,Class,Year,Grades(#):Grades,Comment(#):Comment)",A1:E4)
It looks a bit long, but in fact, we only copied the column names once, and the formula itself is not difficult, and SPL also provides an environment for easy editing of such long formulas.
In addition to calculation issues, Excel also lacks some operations, such as the example of table row column conversion mentioned earlier:

To convert this table into the format shown in the following figure, it should be listed in the order of Chinese, Maths, and English:

This requirement is very simple. To put it simply, it is just a crosstab, but there is an additional ID column on the left, which means that the ID and Name on the left correspond one-to-one. If you use Excel’s pivot function, it looks like this:

The ID and Name have become a one-to-many relationship, and the Maths and English columns cannot be arranged in the specified order. The pivot function cannot handle this matter, and the transpose function also fails. We can only manually adjust the format. It’s okay if the data amount is small, but if the data amount is large, this format adjustment can also drive people crazy.
Using SPL, it is still a matter of one formula:
=spl("=E(?1).pivot(ID,Name;Subject,Score; ""Chinese"",""Maths"",""English"")",Sheet1!A1:D13)
Isn’t it exceptionally simple?
There are many similar hard problems in Excel, such as:
- Find the price corresponding to the current purchase quantity from the tiered price table
- Count the number of people grouped by score segment
- Calculate the overlapping duration of two date ranges
- Identify the dates where both the previous and subsequent day have sales revenue lower than that of the current day by more than 500
- Filter with subtotaled values
- Remove duplicate data
- Strip the date information from a paragraph of text
- ……
Most of these things require manual operation in Excel, which is time-consuming and labor-intensive. And using SPL can make up for the shortcomings of Excel, which can be easily solved in just one or two statements.
To sum up
-
Excel is easy to use, but lacks automation and set related functions, which can result in a large amount of manual operations in some slightly complex tasks and low efficiency.
-
SPL programming can automate batch processing; Plugins solve intra sheet calculations and format conversion issues; Rich set operations can easily handle various data processing difficulties, often solving a tricky problem in one or two statements.
-
To learn SPL, please refer to SPL Programming - Preface ; You can learn and master as long as you have high school knowledge.
-
When encountering Excel difficulties in the workplace, please refer to esProc Desktop and Excel Processing ; Here are over a hundred examples, just copy and modify them. There is always one that suits you, so take it.
SPL Official Website 👉 https://www.scudata.com
SPL Feedback and Help 👉 https://www.reddit.com/r/esProc_Desktop/
SPL Learning Material 👉 https://c.scudata.com
Discord 👉 https://discord.gg/cFTcUNs7
Youtube 👉 https://www.youtube.com/@esProcDesktop
Linkedin Group 👉 https://www.linkedin.com/groups/14419406/


Chinese version