Generate the Text Histogram
Problem
This problem aims to simulate the histogram via text.
Below is the Employee table, in which the DEPTNO field indicates the department the employee belongs to.
| EMPNO | ENAME | DEPTNO |
|---|---|---|
| 7934 | Miller | 10 |
| 7782 | Clark | 10 |
| 7839 | King | 10 |
| 7902 | Ford | 20 |
| 7788 | Scott | 20 |
| 7876 | Adams | 20 |
| 7566 | Jones | 20 |
| 7369 | Smith | 20 |
| 7900 | James | 30 |
| 7844 | Turner | 30 |
| 7654 | Martin | 30 |
| 7521 | Ward | 30 |
| 7499 | Allen | 30 |
| 7698 | Blake | 30 |
Now, we use text histogram to indicate the number of employees of each department, with one “*” representing one employee, and the result set illustrated by the horizontal histogram should be like this:
| DEPTNO | CNT |
|---|---|
| 10 | *** |
| 20 | ***** |
| 30 | ****** |
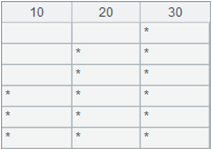
The result set illustrated in the vertical histogram should be like this:
| D10 | D20 | D30 |
|---|---|---|
| * | ||
| * | * | |
| * | * | |
| * | * | * |
| * | * | * |
| * | * | * |
Please develop the program to generate the result set.
Tip
1. Horizontal histogram: First, create a table sequence with DEPTNO and CNT fields. Group DEPTNO table by department . Loop through the grouped data and insert every department and *s that represent employees in the current department.
2. Vertical histogram: First, create a table sequence with the field names being dynamically retrieved departments, then count the employees of each department to get the maximum number, and insert the maximum number of blank records to the table sequence. Loop through the table sequence by column to insert the * to the table sequence.
Code
| A | B | ||
|---|---|---|---|
| 1 | =file("C:\\txt\\DEPTNO.txt").import@t() | Load the department table | |
| 2 | /Horizontal histogram | ||
| 3 | =create(DEPTNO,CNT) | Construct the result sequence | |
| 4 | =A1.group(DEPTNO) | Group by DEPTNO | |
| 5 | for A4 | ||
| 6 | =A3.insert(0,A5.DEPTNO,fill("*",A5.count())) | Insert records to the sequence. The first field is DEPTNO, and the second field is the * repeated for the number of employees | |
| 7 | /Vertical histogram | ||
| 8 | =create(${A3.(DEPTNO).concat(",")}) | Result sequence; field name is the dynamically retrieved DEPTNO | |
| 9 | =A4.(~.count()) | Count the departmental employee numbers | |
| 10 | =A9.max() | Count the employee numbers of the largest department | |
| 11 | >A8.insert(A10) | Insert the blank record according to the maximum department numbers | |
| 12 | for A9 | ||
| 13 | >A8.to(-A12).field(#A12,"*") | Fill in the * column by column |
Result
Horizontal histogram returned by A3

Vertical histogram returned by A8

SPL Official Website 👉 https://www.scudata.com
SPL Feedback and Help 👉 https://www.reddit.com/r/esProc_SPL
SPL Learning Material 👉 https://c.scudata.com
SPL Source Code and Package 👉 https://github.com/SPLWare/esProc
Discord 👉 https://discord.gg/cFTcUNs7
Youtube 👉 https://www.youtube.com/@esProc_SPL


Chinese version
Data file
DEPTNO.txt