

Excel Advanced Group and Summary Method
The group and summary of data is a common problem encountered during work. For simple requirements such as summing, averaging, and counting, it can be achieved directly using Excel’s group and summary or pivot tables. However, when encountering more complex requirements, it is impossible or difficult to implement them, such as filtering and sorting the grouped data based on the summarized values or calculating the ranking within each group. Moreover, Excel’s group and summary operations are not flexible enough, such as how to copy and extract summary items and automatically update them; how to export each type of data after group and summary to a new Excel sheet, and so on, often it is difficult to achieve the desired effect even after hours of operation.
Here we have compiled several commonly encountered examples of Excel group and summary, and provided hands-on instructions on how to solve them.
Firstly, a plugin SPL needs to be installed on Excel, and the installation method can be found at the end of the article.
SPL is similar to Python and can handle various complex Excel operations, but its code is simpler than Python. Using SPL to assist Excel calculations doubles work efficiency in seconds.
For example, there are different classes with math, English, and physical education scores as follows:

We summarize this data in several different ways.
Example 1: Simple multi column classification summary
Calculate the total number of people and average score of each class as shown in the following figure:
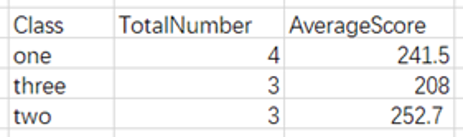
The first small problem is to calculate the total number of people in each group, which can be easily implemented using count of group function in Excel; The second small problem involves the reference of multiple columns to participate in the calculation (total score=Math+English+PE), which is a little more troublesome to handle in Excel. It needs to first add a column to calculate the total score of each person, and then group and summarize the average of the total score. The effect after completion in Excel is shown in the following figure.

Calling the SPL plugin function is more straightforward, and it can directly summarize on the original data in one step.
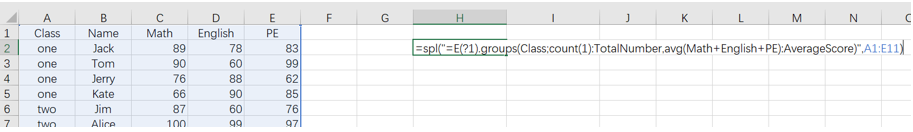
The operation method is very simple. Enter the code in an Excel blank cell:
=spl("=E(?).groups(Class;count(~):TotalNumber,avg(Math+English+PE):AverageScore)",A1:E11)
Then press the ctrl Enter key to return the summary result:
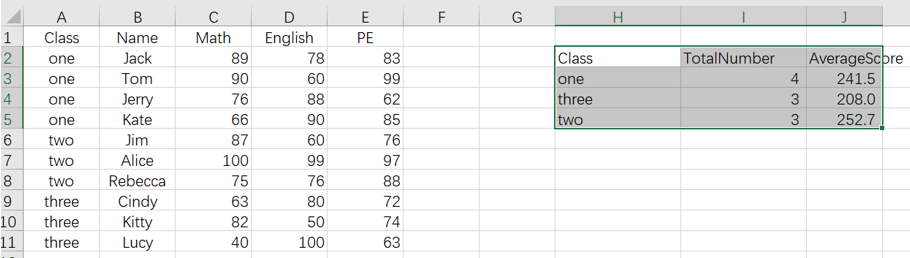
Code explanation: as literal, groups()represents grouping aggregation, grouping by Class, and calculating the summary items after the semicolon. count() is the counting function, and avg() is the average. E? indicates the range of the sheet that need to be summarized and calculated, in this example, A1: E11.
When there are fewer summary items, the complexity of the two methods is similar, but when there are more summary items or there are more summary calculations involving referencing multiple columns, using SPL is more appropriate.
Another advantage of using SPL to return results is that it can directly extract summary results, and the extracted results can be automatically updated when the source data changes.
Example 2: Filtering, sorting, and summarizing after data grouping
Calculate the number of people in each class who score above 90 in mathematics, the number of people who fail English, and the average PE score after removing one highest score and one lowest score.
These questions all involve grouping data by class first, and then filtering and summarizing within the group.
In Excel, a pivot table has both filtering and aggregation functions, but it is difficult to implement this example. Firstly, its rule is to filter first and then group, which cannot achieve data filtering within the group, such as the highest and lowest scores within each group.
Moreover, the filtering logic for multiple columns in the pivot table is logic AND, such as counting the number of people in each class who score above 90 in mathematics and the number of people who fail in English; If the operation is done in the same pivot table, the filtering result is the number of people who score above 90 in mathematics as well as fail in English, and it needs to operate separately in two pivot tables to achieve this example. The operation is troublesome and prone to errors.
With the help of the SPL function, the problem is much simpler. By using a grouping function group(), it is easy to implement filtering and sorting in each group. The specific code is as follows:
=spl("=E(?).group(Class;~.count(Math>=90):MathAbove90,~.count(English<60):EnglishFailed,~.(PE).sort().m(2:-2).avg():PEAvg)",A1:E11)
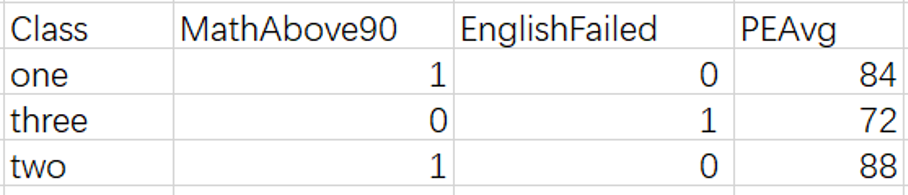
group()is a grouping function. Group by class, and then filter out the rows within each group that meet the conditions for summarization. sort() is a sorting function, where m(2:-2) represents getting members from the second to the second to last. ~.(PE).sort().m(2:-2).avg() represents sorting the physical education scores of each class from the second member to the penultimate, and then calculating the mean.
Example 3: After group and summary, generate a separate sheet for each group.
Group and summarize the scores in the sheet by class, summarize the total scores for each subject, and then generate a separate sheet for each class, as shown in the figure:

It is easy to summarize in Excel, but to export to a separate sheet needs to manually copy and paste one by one, which is too troublesome and not advisable.
It is more convenient to operate directly in the SPL IDE, with the following code:
| A | |
|---|---|
| 1 | =T("D:/Score.xlsx") |
| 2 | =A1.group(Class;~.array()|[["Total",,~.sum(Math),~.sum(English),~.sum(PE)]]:a) |
| 3 | =A2.(a.record()) |
| 4 | =A3.(file("D:/Score.xlsx").xlsexport@kt(~;~.Class)) |
A2 Group by class, summarize the total score of each subject and add it to the last row of the class
A3 Obtain the summary score table for each class
A4 Export the scores of each class separately to a new sheet
For group and summary problems, it is convenient to use Excel’s group and summary or SPL for direct aggregation (sum, mean, count, etc.) of a certain column or several columns. For more complex problems or situations where the summary results need to be extracted, SPL is more suitable. And the syntax of SPL is simple and in line with human natural logical thinking (such as counting the number of people with a score of 90 or above in mathematics: count(Math>=90)), making it very easy to learn.
Using the SPL plugin to summarize and extract data is simple, convenient, and efficient, and there are also rich Excel operation cases that can be referenced esProc Desktop and Excel Processing , to help you easily solve various Excel problems in the workplace.
SPL download address: esProc Desktop Download
Plugin Installation Method: SPL XLL Installation and Configuration
SPL Official Website 👉 https://www.scudata.com
SPL Feedback and Help 👉 https://www.reddit.com/r/esProc_Desktop/
SPL Learning Material 👉 https://c.scudata.com
Discord 👉 https://discord.gg/2bkGwqTj
Youtube 👉 https://www.youtube.com/@esProcDesktop
Linkedin Group 👉 https://www.linkedin.com/groups/14419406/


Chinese version