Select variables using p-value
The method of statistical hypothesis testing can also be used to determine whether the independent variable has a significant impact on the dependent variable. SPL provides several functions for statistical testing p-value calculation. Function usage: p value (raqsoft.com).
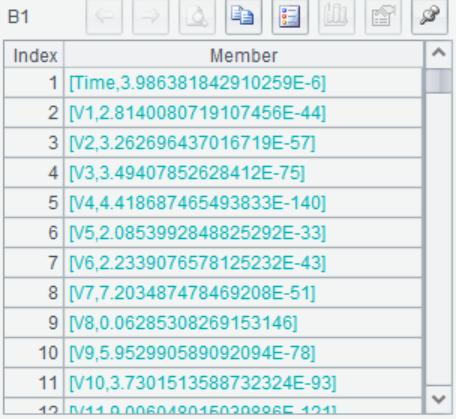
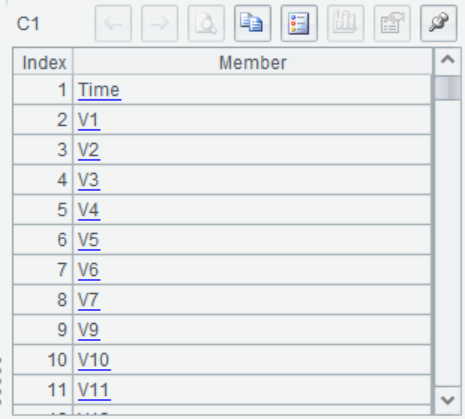
In this case, variables in credit card data were selected in the form of T-test, and the screening criteria was to retain variables with a p-value less than 0.01.
A |
B |
C |
|
1 |
=file("D://test//creditcard_b.csv").import@tc() |
||
2 |
=A1.fname() |
||
3 |
=A2.delete(A2.pos("Class")) |
||
4 |
for A2 |
=ttest_p(A1.(${A4}),A1.(Class)) |
|
5 |
>B1=B1|[A4|B4] |
||
6 |
=if(B4<0.01,A4) |
||
7 |
>C1=C1|B6 |
A2 Get field names
A3 Deletes the target field name
A4-B7 Loop each field, calculate the p-value of each independent variable and target variable respectively and put the results into B1, and filter the variables with a P-value less than 0.01 into C1


SPL Official Website 👉 https://www.scudata.com
SPL Feedback and Help 👉 https://www.reddit.com/r/esProcSPL
SPL Learning Material 👉 https://c.scudata.com
SPL Source Code and Package 👉 https://github.com/SPLWare/esProc
Discord 👉 https://discord.gg/2bkGwqTj
Youtube 👉 https://www.youtube.com/@esProc_SPL


