

Elastic Net regression
Continue to use the sample data in the lasso regression section above, and use elastic net regression to fit
A |
|
1 |
[[1.1,1.1],[1.4,1.5],[1.7,1.8],[1.7,1.7],[1.8,1.9],[1.8,1.8],[1.9,1.8],[2.0,2.1],[2.3,2.4],[2.4,2.5]] |
2 |
[16.3,16.8,19.2,18,19.5,20.9,21.1,20.9,20.3,22] |
3 |
=elasticnet(A1,A2,0.01,10000,0.9,0.1) |
4 |
=elasticnet(A1,A3) |
5 |
=canvas() |
6 |
=A5.plot("NumericAxis","name":"y_pre","autoCalcValueRange":false,"autoRangeFromZero":false,"maxValue":25,"minValue":15,"title":"prediction data") |
7 |
=A5.plot("NumericAxis","name":"y","location":2,"autoCalcValueRange":false,"autoRangeFromZero":false,"maxValue":25,"minValue":15,"title":"observation data","titleAngle":270) |
8 |
=A5.plot("Dot","lineWeight":0,"lineColor":-16776961,"markerWeight":1,"axis1":"y_pre","data1":A4.conj(),"axis2":"y","data2": A2) |
9 |
=to(15:25) |
10 |
=A5.plot("Line","markerStyle":0,"axis1":"y_pre","data1":A9,"axis2":"y", "data2":A9) |
11 |
=A5.draw(600,600) |
A1 Input data x
A2 Input data y
A3 Use elastic net to fit the data, 0.01 represents the learning rate, 10000 represents the number of iterations,0.9 represents the L1 coefficient, 0.1 represents the L2 coefficient, and return the model information
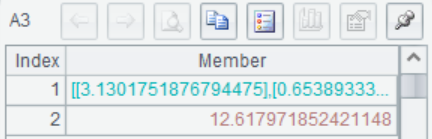
A3(1) The coefficient matrix
A3(2) The intercede
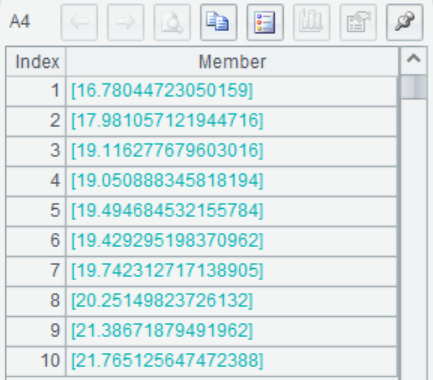
A4 Use the model built in A3 to make predictions on A1, return the prediction result.
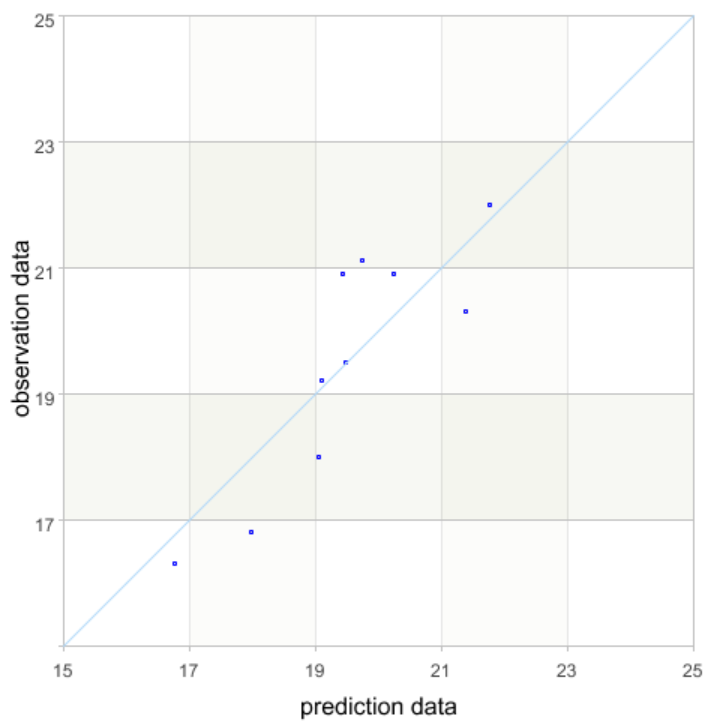
A5-A11 Draw a picture to evaluate the model performance. The horizontal axis represents the predicted value for each sample, and the vertical axis represents the true value of the observed data. If all the points can be evenly distributed near the diagonal, then the fitting value of the equation has little difference from the original value, and the fitting performance of the equation is good.If the model performance is not ideal, it can be optimized by adjusting the learning rate and the number of iterations
A5 Generate canvas
A6 Plot the horizontal axis, the prediction value
A7 Draw the vertical axis, the true value of the observation data
A8 Plot point primitives with the horizontal axis is the predicted value and the vertical axis is the true value
A9 Take a fixed interval of [15,25]
A10 Draw a line, y=x
A11 Perform the drawing
SPL Official Website 👉 https://www.scudata.com
SPL Feedback and Help 👉 https://www.reddit.com/r/esProcSPL
SPL Learning Material 👉 https://c.scudata.com
SPL Source Code and Package 👉 https://github.com/SPLWare/esProc
Discord 👉 https://discord.gg/2bkGwqTj
Youtube 👉 https://www.youtube.com/@esProc_SPL

