

Accuracy, Precision, Recall, Specificity, F1
Before calculating the various evaluation indicators, the confusion matrix needs to be calculated first:
True Positive , TP: positive samples predicted as positive by the model.
False Positive , FP: negative samples predicted as positive by the model.
False Negative , FN: positive samples predicted as negative by the model.
True Negative , TN: negative samples predicted as negative by the model.
The calculation formula of each index is as follows:
Accuracy, ACC=(TP+TN)/N,
Precision, PPV=TP/(TP+FP),
Sensitivity/Recall, TPR=TP/(TP+FN),
Specificity, TNR=TN/(FP+TN),
F1=2*Precision*Recall/(Precision+Recall)
For example, in the titanic_export.csv data, there are the true value of the target “Survived“ and the predicted value “Survived_predict“ with a threshold of 0.5, and the probability predicted value “Survived_1_percentage“ of the target variable being 1
Survived_1_percentage |
PassengerId |
Survived |
Survived_predict |
0.146539017 |
1 |
0 |
0 |
0.966226989 |
2 |
1 |
1 |
0.644612591 |
3 |
1 |
1 |
0.970606942 |
4 |
1 |
1 |
0.096753954 |
5 |
0 |
0 |
… |
… |
… |
… |
Evaluate the performance of the the predict value “Survived_predict“ with a threshold of 0.5
A |
B |
|
1 |
=T("D://titanic_export.csv") |
|
2 |
=A1.select(Survived==1 && Survived_predict==1) |
|
3 |
=A1.select(Survived==0 && Survived_predict==1) |
|
4 |
=A1.select(Survived==1 && Survived_predict==0) |
|
5 |
=A1.select(Survived==0 && Survived_predict==0) |
|
6 |
>TP=A2.len(),FP=A3.len(),FN=A4.len(),TN=A5.len(),N=A1.len() |
|
7 |
=(TP+TN)/N |
/Accuracy |
8 |
=TP/(TP+FP) |
/Precision |
9 |
=TP/(TP+FN) |
/Sensitivity/Recall |
10 |
=TN/(FP+TN) |
/Specificity |
11 |
=2*A8*A9/(A8+A9) |
/F1 |
A2 The positive samples predicted by the model to be positive
A3 The negative samples predicted by the model to be positive
A4 The positive samples predicted by the model to be negative
A5 The negative samples predicted by the model to be negative
A6 Calculate TP,FP,FN,TN,N
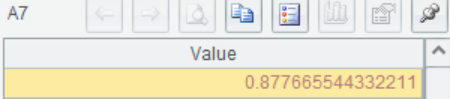
A7 Calculate the Accuracy
A8-A11 Similarly, calculate other indicators according to the formula
SPL Official Website 👉 https://www.scudata.com
SPL Feedback and Help 👉 https://www.reddit.com/r/esProcSPL
SPL Learning Material 👉 https://c.scudata.com
SPL Source Code and Package 👉 https://github.com/SPLWare/esProc
Discord 👉 https://discord.gg/2bkGwqTj
Youtube 👉 https://www.youtube.com/@esProc_SPL

