

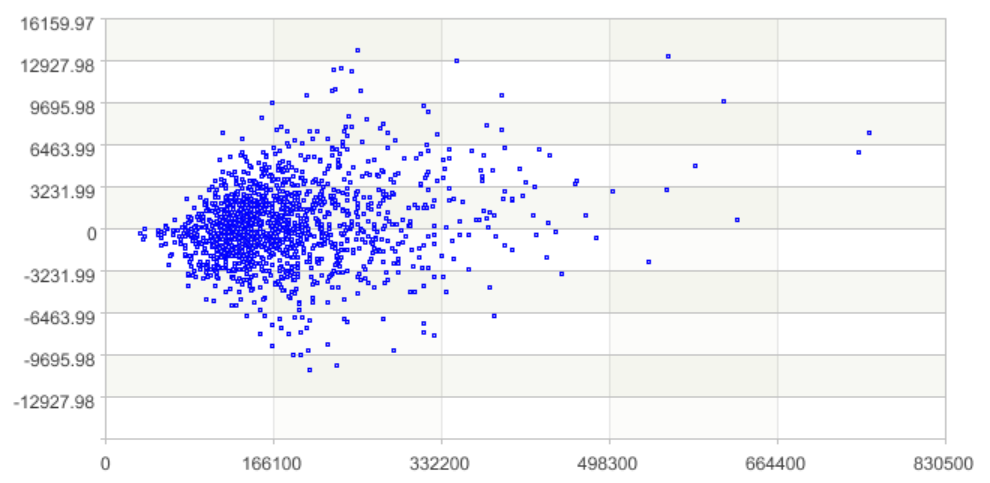
Residual plot
Residual=True value - prediction value
Calculate and plot residuals in houseprice result.xls
A |
|
1 |
=T("houseprice_result.xls") |
2 |
=A1.derive(SalePrice-SalePrice_predictvalue:Residual) |
3 |
=canvas() |
4 |
=A3.plot("NumericAxis","name":"x") |
5 |
=A3.plot("NumericAxis","name":"y","location":2,"autoRangeFromZero":false) |
6 |
=A3.plot("Dot","lineWeight":0,"lineColor":-16776961,"markerWeight":1,"axis1":"x","data1":A2.(SalePrice),"axis2":"y","data2": A2.(Residual)) |
7 |
=A3.draw(800,400) |
A2 Residual. Calculate the Residual
A3-A7 Take SalePrice on the x axis and Residual on the y axis to draw the scatter plot, which is the residual plot
SPL Official Website 👉 https://www.scudata.com
SPL Feedback and Help 👉 https://www.reddit.com/r/esProcSPL
SPL Learning Material 👉 https://c.scudata.com
SPL Source Code and Package 👉 https://github.com/SPLWare/esProc
Discord 👉 https://discord.gg/2bkGwqTj
Youtube 👉 https://www.youtube.com/@esProc_SPL

