

SPL Programming Exercise - Chapter 8 Data table
8.2 Table sequence and record sequence
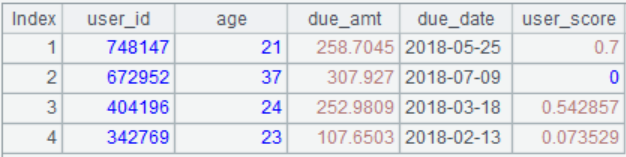
1. There are field names: [“user_id”,“age”,“due_amt”,“due_date”,“user_score”]
Data: [[748147, 21, 258.7045, 2018/5/25, 0.7],[672952, 37, 307.927, 2018/7/9,0],[404196, 24, 252.9809, 2018/3/18, 0.542857],[342769, 23, 107.6503, 2018/2/13, 0.073529],[828139, 23, 201.0499, 2018/7/1, 0.666667]]
(1) Generate a table sequence with the given field names and data, where each subsequence of the data is a record
(2) Insert a row of data 795130,31, 3730.995, 2018/11/25, 0.142857 before the first record in the table sequence
(3) Find the length of the table sequence
(4) Get the first record of the table sequence
(5) Get the third to last record of the table sequence
(6) Compare the user_score values of (4) and (5) and output the user_id with the higher score
(7) Get the 3rd to 5th rows of the table sequence
(8) Get the first, third, and fifth rows of the table sequence
(9) Change the user_score in the second row of (8) to 0.85 and observe the changes of the same record in the original table and in (7)
(10) Calculate the union of record sequence (7) and (8) and calculate the length of the union
(11) Create a new table sequence with fields named Id, Age, Amt
(12) Insert the records in (10) into (11) according to their corresponding fields
(13) Save the original table sequence of (1) as “user_1.xlsx” and the table sequence of (10) as “user_2.xlsx”
2. Merge the generated “user_1.xlsx” and “user_2.xlsx” in question 1 into one file and name it “user.xlsx”
3. Split the file “user.xlsx” into small files named user1, user2, etc., based on the number of rows, with every 3 rows divided into one smaller file
8.3 Generation of table sequence
1. Use “user_id”, “age”,“due_amt”, “due_date”, “user_score” as field names, and each sub member of the sequence [[748147, 21, 258.7045, 2018/5/25, 0.7],[672952, 37, 307.927, 2018/7/9,0],[404196, 24, 252.9809, 2018/3/18, 0.542857],[342769, 23, 107.6503, 2018/2/13, 0.073529],[828139, 23, 201.0499, 2018/7/1, 0.666667]] as a record, and generate a table sequence as shown in the following figure.
2. Insert 100 pieces of data into the table sequence of question 1, where “user_id” and “age” take random integers, “due_amt” and “user_score” take random floating-point numbers, “due_date” takes any date of 2018, and save the table as “user_104.xlsx”
3. Use the field “amt_flag” to indicate the users in the table sequence of question 2 whose “due_amt” is greater than 500. If it is greater than 500, mark it as 1. Otherwise, mark it as 0 (implemented using A.new() and A.derive()respectively)
4. Merge “user_1.xlsx” and “user_2.xlsx” from Exercise 8.2 and add the column “File” to display the data source
8.4 Loop functions
1.
(1) Program to generate a student score table, as shown in the following image. The student ID ranges from 1 to 50, and the score is a random number within 100.

(2) Calculate the highest score in math, the average in English and the lowest total score
(3) Identify the student with the highest math score and the student with the lowest total score
(4) Select individuals with English scores above 80 and those with math scores above 80 respectively
(5) Select individuals with English or math scores above 80
(6) Select individuals who score above 80 in English but have not achieved 80 in math
(7) Calculate the highest total score for individuals who score above 80 in both English and math
(8) Add the field “total” to the transcript to calculate the total score and sort it in descending order of total score
(9) Sort the score table in descending order of English and ascending order of PE
(10) Calculate the top 5 total scores and the top 5 people in total scores
(11) Change “student_id” to string
(12) Add the field “total_rank” to represent the ranking of each student, and rate those with a total_rank<=25 as A and the rest as B, represented by the field flag
(13) Calculate the maximum difference in math scores between A-level and B-level students in this group of students
(14) Calculate the student pair with the largest difference in math scores between A-level and B-level students
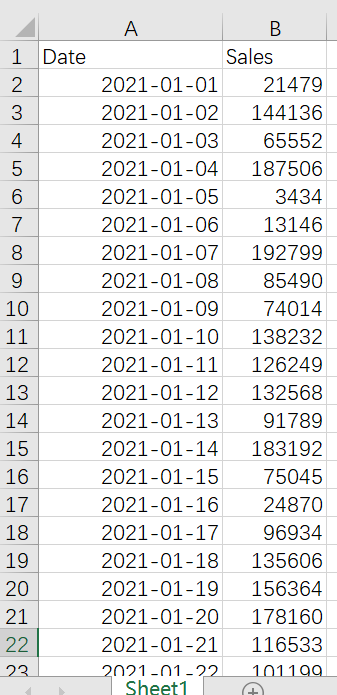
2. Daily sales data of a certain product in January 2021 in Excel
(1) Filter out sales data for even days
(2) Filter out sales data for Saturdays and Sundays
(3) Calculate daily sales growth and cumulative sales
(4) Calculate the longest consecutive increase in sales in number of days for this product
(5) Calculate the increase in sales on the highest day
(6) Calculate the dates and increases in sales exceeding 150000 dollar
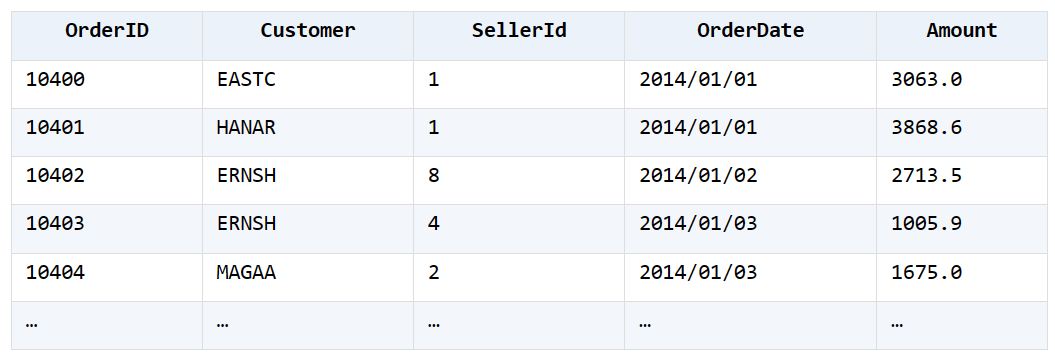
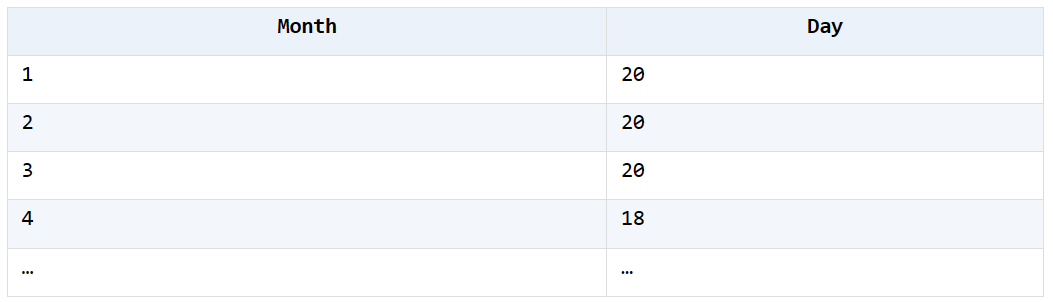
3. The order sales table Orders.xlsx is shown in the following figure, calculate the number of days required to reach 20 orders per month in 2014
The statistical effect is shown in the figure
8.5 Calculations on the fields
1.
(1) Program to generate a student score table, as shown in the following figure. The student ID ranges from 1 to 50, and the score is a random number within 100. (Implemented using macros)
(2) Insert a column of class before all columns, indicating the class of the student. Students 1-25 are labeled as one, and students 26-50 are labeled as two
(3) Add the field total to calculate the total score for each student
2. Modify the English score in the student score table in question 1 to a random number between 60 and 100
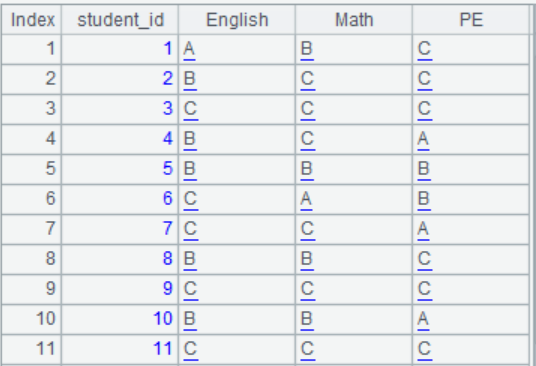
3. Divide the scores of each subject in the student score table into levels and use A, B, and C to represent them. Scores above 90 are A, 60-89 are B, and scores below 60 are C. The modification effect is shown in the figure
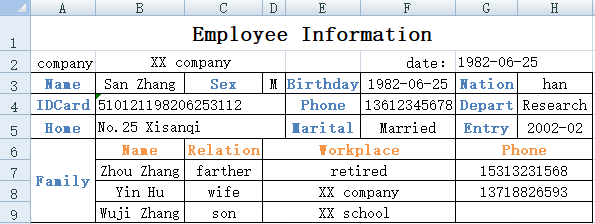
4. In the employee information registration form file staff.xlsx, each sheet contains employee information and their family member information. Please parse the employee information and family member information into two structured data tables. One of the sheets is shown below:
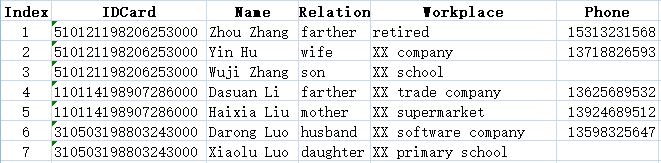
Analysis effect
Employee Information Table:

Family member information table:
Suggested answers:
8.2 Table sequence and record sequence
1.
| A | B | C | |
|---|---|---|---|
| 1 | [“user_id”,“age”,“due_amt”,“due_date”,“user_score”] | [[748147, 21, 258.7045, 2018/5/25, 0.7],[672952, 37, 307.927, 2018/7/9,0],[404196, 24, 252.9809, 2018/3/18, 0.542857],[342769, 23, 107.6503, 2018/2/13, 0.073529],[828139, 23, 201.0499, 2018/7/1, 0.666667]] | =([A1]|B1).record() |
| 2 | =C1.insert(1,795130,31, 3730.995, string(“2018/11/25”), 0.142857) | ||
| 3 | =C1.len() | ||
| 4 | =C1(1) | ||
| 5 | =C1.m(-3) | ||
| 6 | >output(“user”/if(A4.user_score>A5.user_score,A4.user_id,A5.user_id)/“is better”) | ||
| 7 | =C1.to(3,5) | ||
| 8 | =C1.m([1,3,5]) | ||
| 9 | >A8(2).user_score=0.85 | ||
| 10 | =A7&A8 | =A10.len() | |
| 11 | =create(Id,Age,Amt) | ||
| 12 | =A11.insert(0:A10,user_id:Id,age:Age,due_amt:Amt) | ||
| 13 | =file(“user_1.xlsx”).xlsexport@t(C1) | =file(“user_2.xlsx”).xlsexport@t(A10) |
2.
| A | |
|---|---|
| 1 | =directory@p(“data/*.xlsx”).(file(~).xlsimport@t()).conj() |
| 2 | >file(“user.xlsx”).xlsexport@t(A1) |
3.
| A | |
|---|---|
| 1 | =file(“user.xlsx”).xlsimport@t() |
| 2 | =A1.len().step(3,1) |
| 3 | =A2.(file(“data/user”/#/“.xlsx”).xlsexport@t(A1.to(~,~+2))) |
8.3 Generation of table sequence
1-3
4.
| A | |
|---|---|
| 1 | [[748147, 21, 258.7045, 2018/5/25, 0.7],[672952, 37, 307.927, 2018/7/9,0],[404196, 24, 252.9809, 2018/3/18, 0.542857],[342769, 23, 107.6503, 2018/2/13, 0.073529]] |
| 2 | =A1.new(A1(#)(1):user_id,A1(#)(2):age,A1(#)(3):due_amt,date(A1(#)(4),“yyyy/MM/dd”):due_date,A1(#)(5):user_score) |
| 3 | =A2.insert(0:100,int(rand()*1000000):user_id,rand(42)+18:age,rand()*1000:due_amt,date(“2018-01-01”)+rand(365):due_date,rand():user_score) |
| 4 | >file(“C:/Users/29636/Desktop/tmp/user_104.xlsx”).xlsexport@t(A3) |
| 5 | =A2.new(user_id,if(due_amt>500,1,0):amt_flag) |
| 6 | =A2.derive(if(due_amt>500,1,0):amt_flag) |
| A | |
|---|---|
| 1 | =directory@p(“data/*.xlsx”) |
| 2 | =A1.(file(~).xlsimport@t().derive(filename@n(A1.~):File)).conj() |
| 3 | >file(“user.xlsx”).xlsexport@t(A2) |
8.4 Loop functions
1.
| A | B | C | |
|---|---|---|---|
| 1 | =50.new(~:student_id,rand(100):English,rand(100):Math,rand(100):PE) | ||
| 2 | =A1.max(Math) | =A1.avg(English) | =A1.min(English+Math+PE) |
| 3 | =A1.maxp@a(Math) | =A1.minp@a(English+Math+PE) | |
| 4 | =A1.select(English>=80) | =A1.select(Math>=80) | |
| 5 | =A4&B4 | ||
| 6 | =A4\B4 | ||
| 7 | =(A4^B4).max(English+Math+PE) | ||
| 8 | =A1.derive(English+Math+PE:total) | =A8.sort@z(total) | |
| 9 | =A8.sort(-English,PE) | ||
| 10 | =A8.top(-5,total) | =A8.top(-5;total) | |
| 11 | >A8.run(student_id=string(student_id)) | ||
| 12 | =A8.ranks@z(total) | =A8.derive(A12(#):total_rank,:flag) | >B12.run(flag=if(total_rank<=25,“A”,“B”)) |
| 13 | =B12.select(flag==“A”) | =B12.select(flag==“B”) | =A13.max(B13.max(abs(A13.Math-Math))) |
| 14 | =A13.conj(B13.([A13.~,~])) | =A14.maxp@a(abs(~(1).Math-~(2).Math)) |
2.
| A | B | |
|---|---|---|
| 1 | =T(“C:/Users/29636/Desktop/tmp/dailysales.xlsx”) | |
| 2 | =A1.select(#%2==0) | |
| 3 | =A1.select(day@w(Date)==7 || day@w(Date)==1) | |
| 4 | =A1.derive(Sales-Sales[-1]:Gain,Sales+CumSales[-1]:CumSales) | |
| 5 | =(a=0,A4.(if(Gain>0,a+=1,a=0))).max() | |
| 6 | =A4.maxp(Sales).Gain | |
| 7 | =A4.pselect@a(Sales>150000) | =A4.calc(A7,Gain) |
| 8 | =A7.new(A4(~).Date,B7(#):Gain) |
3.
| A | |
|---|---|
| 1 | =T (“Orders.xlsx”) |
| 2 | =A1.select(year(OrderDate)==2014) |
| 3 | =A2.sort(OrderDate) |
| 4 | =A3.select(seq(month(OrderDate))==20) |
| 5 | =A4.new(month(OrderDate):month,day(OrderDate):day) |
A2 select data for 2014
A3 Sort by order date
A4 uses the function seq() to calculate the order number for each month and selects records with a number of 20 for each month
A5 calculates the month and day based on the order date with serial number 20 for each month, which is the result obtained
8.5 Calculations on the fields
1.
2.
| A | |
|---|---|
| 1 | [English,Math,PE] |
| 2 | =A1.(“rand(100):”/~).concat@c() |
| 3 | =50.new(~:student_id,${A2}) |
| 4 | =A3.fname().concat@c() |
| 5 | =A3.new(if(student_id<=25,“one”,“two”):class,${A4}) |
| 6 | =A5.derive(~.array().to(3,).sum():total) |
| A | |
|---|---|
| 1 | [English,Math,PE] |
| 2 | =A1.(“rand(100):”/~).concat@c() |
| 3 | =50.new(~:student_id,${A2}) |
| 4 | =A3.field(“English”,50.(60+rand(40))) |
3.
| A | B | C | |
|---|---|---|---|
| 1 | [English,Math,PE] | ||
| 2 | =A1.(“rand(100):”/~).concat@c() | ||
| 3 | =50.new(~:student_id,${A2}) | ||
| 4 | for A1 | =A3.field(A4) | =B4.(if(~>=90:“A”,~<60:“C”;“B”)) |
| 5 | >A3.field(A4,C4) |
4.
| A | B | C | |
|---|---|---|---|
| 1 | =create(IDCard,Name,Sex,Birthday,Nation,Phone,Depart,Home,Marital,Entry) | ||
| 2 | =create(IDCard,Name,Relation,Workplace,Phone) | ||
| 3 | [B4,B3,D3,F3,H3,F4,H4,B5,F5,H5] | ||
| 4 | =file(“staff.xlsx”).xlsopen() | ||
| 5 | for A4 | =A3.(eval($[A4.xlscell(]/~/“,"”/A5.stname/“")”)) | >A1.record(B5) |
| 6 | =A4.xlsimport@t(Family,Name,Relation,Workplace,Phone;A5.stname,6) | ||
| 7 | =B6.rename(Family:IDCard) | >B7.run(IDCard=B5(1)) | |
| 8 | >A2.insert@r(0:B7) |
A1 creates an empty table sequence with column names IDCard, Name, Sex, Birthday, Nation, Phone, Department, Home, Marital, and Entry to store employee information in the main table
A2 creates an empty table sequence with column names IDCard, Name, Relationship, Workplace, and Phone, which is used to store employee family member information in the sub table
A3 defines the cell sequence where the employee information in the main table is located
A4 Open Excel data file
A5 loop reads sheet data from Excel files
B5 reads Employee Information Sequence
C5 Save the employee information read by B5 to table sequence A1
B6 Starting from row 6, read employee family member information and only reads the specified 5 columns of Family, Name, Relationship, Workplace, and Phone
B7 renaming the Family column of B6 table sequence to IDCard
C7 assigns the value of IDCard column in the B7 table sequence to IDCard in employee information
B8 Append employee family member information from B7 to table sequence A2
SPL Official Website 👉 https://www.scudata.com
SPL Feedback and Help 👉 https://www.reddit.com/r/esProc_SPL
SPL Learning Material 👉 https://c.scudata.com
SPL Source Code and Package 👉 https://github.com/SPLWare/esProc
Discord 👉 https://discord.gg/cFTcUNs7
Youtube 👉 https://www.youtube.com/@esProc_SPL


Chinese version