

SPL Programming Exercise - Chapter 9 Grouping
9.1 Grouping and aggregation
1. Please count the number of occurrences of each letter in the string “esProc SPL is a smart desktop data analysis tool” (ignoring case, a and A are the same letter)
2.
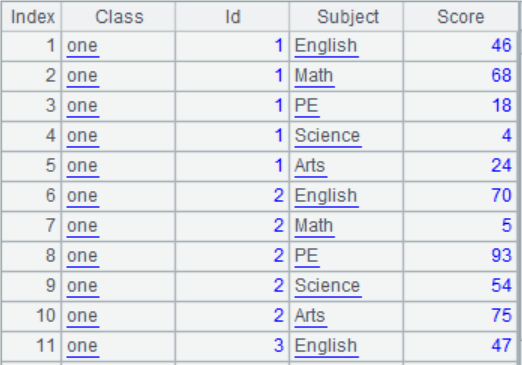
(1) Program to generate a student score table, as shown in the following figure. The student ID ranges from 1 to 50, with 1 to 25 being Class “one” and after the 25th being Class “Two”. The Subject is “English”, “Math”, “PE”, “Science”, and “Arts”, and the Score is a random number within 100.
(2) Calculate the total and average scores for each student, as well as the subject with the highest score
(3) Calculate the average score, highest and lowest scores for each subject in each class
(4) Arrange the scores of each subject in descending order for each class and save them as multiple Excel sheets, with a naming format of Class_Subjects
(5) Calculate the median score and number of students who fail (below 60 points) in each subject of each class
(6) Select individuals with scores of 90 or above in each subject of each class
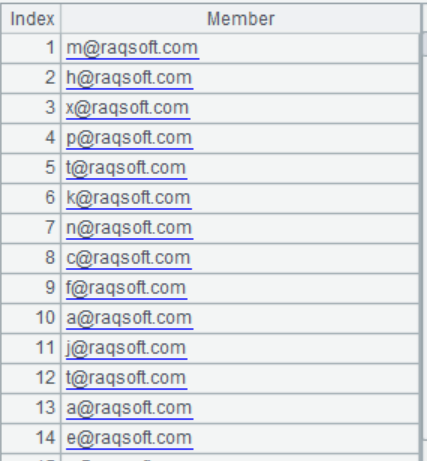
3. Randomly generate a series of email addresses containing duplicate values, such as
(1) Remove duplicate email addresses
(2) Identify duplicate email addresses
4. The behavior and activities of some players on a certain game platform are as follows:
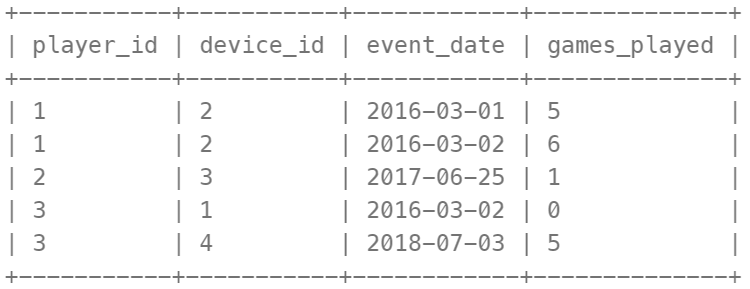
Each row of data records the number of games opened by a player using the same device on the same day before logging off the platform (possibly 0).
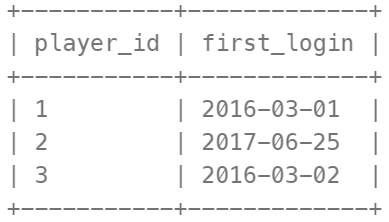
(1) Check the date when each player first logged into the platform.
Result example:
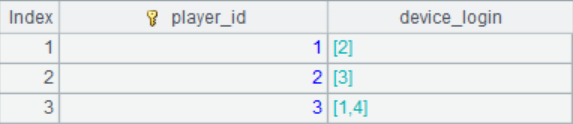
(2) Check which devices each player has used to log in
Result example:
(3) Calculate the ratio of players who log in again on the second day of their first login
- There is an employee table
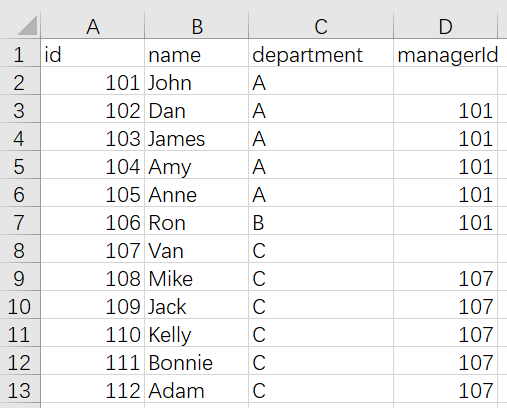
ID is the primary key (column with unique value) of this table.
Each row of the table represents the name of the employee, their department, and the ID of their manager.
If the managerId is empty, then the employee does not have a manager.
No employee will become their own manager.
Write a program to identify the names of managers who have at least five direct reports
9.2 Enumeration and alignment
1. The salary table for employees is as follows: calculate the average salary of departments A, B, and C
| id | name | department | salary |
|---|---|---|---|
| 101 | John | A | 7000 |
| 102 | Dan | B | 11000 |
| 103 | James | A | 9000 |
| 104 | Amy | B | 7000 |
| 105 | Anne | B | 16000 |
| 106 | Ron | A | 8000 |
| 107 | Van | C | 20000 |
| 108 | Mike | C | 7500 |
| 109 | Jack | D | 18000 |
| 110 | Kelly | D | 9500 |
| 111 | Bonnie | C | 12000 |
| 112 | Adam | C | 8500 |
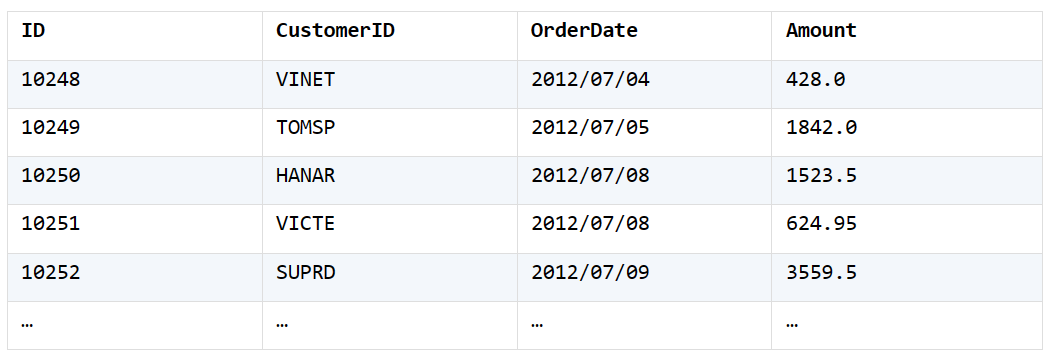
2. According to the order table, list the total number of orders for each month in 2013 in order
3. According to the posting record table, group posts by label and count the frequency of each label appearing in descending order
| ID | Title | Author | Label |
|---|---|---|---|
| 1 | Easy analysis of Excel | John | Excel,ETL,Import,Export |
| 2 | Early commute: Easy to pivot excel | Dan | Excel,Pivot,Python |
| 3 | Initial experience of SPL | James | Basics,Introduction |
| 4 | Talking about set and reference | Amy | Set,Reference,Dispersed,SQL |
| 5 | Early commute: Better weapon than Python | John | Python,Contrast,Install |
| 6 | … | … | … |
Result example:
| Label | Count |
|---|---|
| SPL | 7 |
| SQL | 6 |
| Basics | 5 |
| … | … |
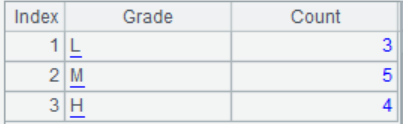
4. According to the employee salary table, divide into three groups of [L, M, H] based on salaries below 8000, 8000~12000, and above 12000, and calculate the number of people in each group. (Implemented separately using enumeration and sequence number grouping)
| id | name | department | salary |
|---|---|---|---|
| 101 | John | A | 7000 |
| 102 | Dan | B | 11000 |
| 103 | James | A | 9000 |
| 104 | Amy | B | 7000 |
| 105 | Anne | B | 16000 |
| 106 | Ron | A | 8000 |
| 107 | Van | C | 20000 |
| 108 | Mike | C | 7500 |
| 109 | Jack | D | 18000 |
| 110 | Kelly | D | 9500 |
| 111 | Bonnie | C | 12000 |
| 112 | Adam | C | 8500 |
Result example:
5. According to the employee salary table, group employees by age criteria (less than 35 years old, less than 45 years old) (can be repeated), calculate the average salary, and assign those who do not meet the criteria to a new group.
| id | name | birthday | salary |
|---|---|---|---|
| 101 | John | 1974/11/20 | 7000 |
| 102 | Dan | 1980/7/19 | 11000 |
| 103 | James | 1970/12/17 | 9000 |
| 104 | Amy | 1985/3/7 | 7000 |
| 105 | Anne | 1975/5/13 | 16000 |
| 106 | Ron | 1988/3/7 | 8000 |
| 107 | Van | 1994/11/20 | 20000 |
| 108 | Mike | 1990/7/19 | 7500 |
| 109 | Jack | 1970/12/17 | 18000 |
| 110 | Kelly | 1985/3/7 | 9500 |
| 111 | Bonnie | 1975/5/13 | 12000 |
| 112 | Adam | 1995/5/13 | 8500 |
9.3 Order-related grouping
1. Divide employees into three groups on average based on their start time (assigned to a certain group according to the order of remainder), and calculate the average salary for each group. Partial data is as follows:
| ID | NAME | BIRTHDAY | ENTRYDATE | DEPT | SALARY |
|---|---|---|---|---|---|
| 1 | Rebecca | 1974/11/20 | 2005/3/11 | R&D | 7000 |
| 2 | Ashley | 1980/7/19 | 2008/3/16 | Finance | 11000 |
| 3 | Rachel | 1970/12/17 | 2010/12/1 | Sales | 9000 |
| 4 | Emily | 1985/3/7 | 2006/8/15 | HR | 7000 |
| 5 | Ashley | 1975/5/13 | 2004/7/30 | R&D | 16000 |
| … | … | … | … | … | … |
2. According to the medal table of previous Olympic Games, determine the country with the longest number of consecutive first place medals and its medal information. Partial data is as follows:
| Game | Nation | Gold | Silver | Copper |
|---|---|---|---|---|
| 30 | USA | 46 | 29 | 29 |
| 30 | China | 38 | 27 | 23 |
| 30 | UK | 29 | 17 | 19 |
| 30 | Russia | 24 | 26 | 32 |
| 30 | Korea | 13 | 8 | 7 |
| … | … | … | … | … |
Game represents the number of Olympic Games
3. What is the maximum consecutive rising days of the closing price of the Shanghai Composite Index in 2020? (On the first trading day, the index rose.) Partial data is as follows:
| DATE | CLOSE | OPEN | VOLUME | AMOUNT |
|---|---|---|---|---|
| 2020/1/2 | 3085.198 | 3066.3357 | 292470208 | 3.27E+11 |
| 2020/1/3 | 3083.786 | 3089.022 | 261496667 | 2.90E+11 |
| 2020/1/6 | 3083.408 | 3070.9088 | 312575842 | 3.31E+11 |
| 2020/1/7 | 3104.802 | 3085.4882 | 276583111 | 2.88E+11 |
| 2020/1/8 | 3066.893 | 3094.2389 | 297872553 | 3.07E+11 |
| … | … | … | … | … |
9.4 Expansion and transpose
1. According to the student score table, calculate the highest scores for each subject in each class and display them in columns. Partial data is as follows:
| CLASS | STUDENTID | SUBJECT | SCORE |
|---|---|---|---|
| 1 | 1 | English | 84 |
| 1 | 1 | Math | 77 |
| 1 | 1 | PE | 69 |
| 1 | 2 | English | 81 |
| 1 | 2 | Math | 80 |
| … | … | … | … |
Expected results:
| CLASS | MAX_MATH | MAX_ENGLISH | MAX_PE |
|---|---|---|---|
| 1 | 97 | 96 | 97 |
| 2 | 97 | 96 | 97 |
| … | … | … | … |
2. Generate a list of each medal based on the Olympic medal tally. Partial data is as follows:
| Game | Nation | Gold | Silver | Copper |
|---|---|---|---|---|
| 30 | USA | 46 | 29 | 29 |
| 30 | China | 38 | 27 | 23 |
| 30 | UK | 29 | 17 | 19 |
| 30 | Russia | 24 | 26 | 32 |
| 30 | Korea | 13 | 8 | 7 |
| … | … | … | … | … |
Expected results:
| Game | Nation | Medal_type | Medals |
|---|---|---|---|
| 30 | USA | Gold | 46 |
| 30 | USA | Silver | 29 |
| 30 | USA | Copper | 29 |
| 30 | China | Gold | 38 |
| 30 | China | Silver | 27 |
| 30 | China | Copper | 23 |
| … | … | … | … |
3. The salary table for employees is as follows:
| Name | Dept | Area | Salary |
|---|---|---|---|
| David | Sales | Beijing | 8000 |
| Daniel | R&D | Beijing | 15000 |
| Andrew | Sales | Shanghai | 9000 |
| Robert | Sales | Beijing | 26000 |
| Rudy | R&D | Shanghai | 23000 |
| … | … | … | … |
Calculate the average salary of each department in different areas, and the expected results are:
| Dept | Beijing | Shanghai | … |
|---|---|---|---|
| R&D | 13000 | 11000 | … |
| Sales | 15000 | 14000 | … |
4. Sales table classified by channel, recorded by year and month. Partial data is as follows:
| YEAR | MONTH | ONLINE | STORE |
|---|---|---|---|
| 2020 | 1 | 2440 | 3746.2 |
| 2020 | 2 | 1863.4 | 448 |
| 2020 | 3 | 1813 | 624.8 |
| 2020 | 4 | 670.8 | 2464.8 |
| 2020 | 5 | 3730 | 724.5 |
| … | … | … | … |
Expected to query the monthly sales revenue of each channel in 2020, expected results:
| CATEGORY | 1 | 2 | 3 | … |
|---|---|---|---|---|
| ONLINE | 2440 | 1863.4 | 1813 | … |
| STORE | 3746.2 | 448 | 624.8 | … |
Suggested answers:
9.1 Grouping and aggregation
1.
| A | |
|---|---|
| 1 | esProc SPL is a smart desktop data analysis tool |
| 2 | =lower(A1).split("“).select(~!=”") |
| 3 | =A2.group(~:letter;~.len():letter_count) |
2.
| A | |
|---|---|
| 1 | =[“English”,“Math”,“PE”,“Science”,“Arts”] |
| 2 | =A1.(50.new(if(~<=25,“one”,“Two”):Class, ~:Id, A1.~:Subject, rand(100):Score)).conj().sort(Id) |
| 3 | =A2.groups(Id;sum(Score):Total,maxp(Score).Subject:Max_sub) |
| 4 | =A2.groups(Class,Subject;avg(Score):Average,max(Score):Max,min(Score):Min) |
| 5 | =A2.group(Class,Subject;~.sort@z(Score):Subscore) |
| 6 | =A5.(file(~.Class/“_”/~.Subject/“.xlsx”).xlsexport@t(~.Subscore)) |
| 7 | =A2.groups(Class,Subject;median(,Score):Median_socre,count(Score<60):Failed_count) |
| 8 | =A2.group(Class,Subject;~.select(Score>=90):Above_90) |
3.
| A | |
|---|---|
| 1 | =30.(char(97+rand(26))/“@raqsoft.com”) |
| 2 | =A1.id() |
| 3 | =A1.group().select(~.len()>1).(~(1)) |
4.
| A | |
|---|---|
| 1 | =T(“player_event.xlsx”) |
| 2 | =A1.groups(player_id;min(event_date):first_login) |
| 3 | =A1.group(player_id;~.(device_id).id():device) |
| 4 | =A1.group(player_id;~.(event_date).contain(min(event_date)+1):continu_login) |
| 5 | =A4.count(continu_login)/A4.len() |
5.
| A | |
|---|---|
| 1 | =T(“employee.xlsx”) |
| 2 | =A1.group(managerId).select(~.len()>=5).(~.managerId) |
| 3 | =A2.(A1.select(A2.~==id).name) |
9.2 Enumeration and alignment
1.
| A | |
|---|---|
| 1 | =T(“salary.xlsx”) |
| 2 | [A,B,C] |
| 3 | =A1.align@a(A2,department) |
| 4 | =A3.new(A2(#):department,~.avg(salary):avg_salary) |
2.
| A | |
|---|---|
| 1 | =T(“orders.xlsx”) |
| 2 | =A1.select(year(Orderdate)==2013) |
| 3 | =A2.groups@n(month(Orderdate):Month;count(id):OrderCount) |
3.
| A | |
|---|---|
| 1 | =T(“post_record.xlsx”) |
| 2 | =A1.conj(Label.split(“,”)).id() |
| 3 | =A1.align@ar(A2.len(),A2.pos(Label.split(“,”))) |
| 4 | =A3.new(A2(#):Label,~.count():Count).sort@z(Count) |
4.
| A | |
|---|---|
| 1 | =T(“salary.xlsx”) |
| 2 | [?<8000,?>=8000 && ?<12000,?>=12000] |
| 3 | [L,M,H] |
| 4 | =A1.enum(A2,salary) |
| 5 | =A4.new(A3(#):Grade,count(~):Count) |
| A | |
|---|---|
| 1 | =T(“salary.xlsx”) |
| 2 | [8000,12000] |
| 3 | [L,M,H] |
| 4 | =A1.group@n(A2.pseg(salary)+1) |
| 5 | =A4.new(A3(#):Grade,count(~):Count) |
5.
| A | |
|---|---|
| 1 | =T(“salary.xlsx”) |
| 2 | [?<35,?<45] |
| 3 | [below 35,below 45] |
| 4 | =A1.enum@nr(A2,age(birthday)) |
| 5 | =A4.new(if (#>A2.len(), “Other”,A3(#)):AGE,~.avg(salary):AvgSalary) |
9.3 Order-related grouping
1.
| A | |
|---|---|
| 1 | =T(“Employee.csv”).sort(ENTRYDATE) |
| 2 | =A1.group@n((#-1)*3\A1.len()+ 1) |
| 3 | =A2.new(#:GROUP_NO, ~.avg(SALARY):AVG_SALARY) |
2.
| A | |
|---|---|
| 1 | =T(“Olympic.txt”) |
| 2 | =A1.sort@z(Game,Gold,Silver,Copper) |
| 3 | =A2.group@o1(Game) |
| 4 | =A3.group@o(Nation) |
| 5 | =A4.maxp@a(~.len()) |
3.
| A | |
|---|---|
| 1 | =T(“SSEC.csv”) |
| 2 | =A1.select(year(DATE)==2020).sort(DATE) |
| 3 | =A2.group@i(CLOSE<CLOSE[-1]) |
| 4 | =A3.max(~.len()) |
9.4 Expansion and transpose
1.
| A | |
|---|---|
| 1 | =T(“Scores.csv”) |
| 2 | =A1.groups(CLASS,SUBJECT; max(SCORE):MAX_SCORE) |
| 3 | =A2.pivot(CLASS; SUBJECT, MAX_SCORE; “Math”:“MAX_MATH”, “English”:“MAX_ENGLISH”, “PE”:“MAX_PE”) |
2.
| A | |
|---|---|
| 1 | =T(“Olympic.txt”) |
| 2 | =A1.pivot@r(Game,Nation;Medal_type,Medals;Gold, Silver, Copper) |
3.
| A | |
|---|---|
| 1 | =T(“salary.txt”) |
| 2 | =A1.pivot@s(Dept; Area, avg(Salary)) |
4.
| A | |
|---|---|
| 1 | =T(“MonthSales.csv”).select(YEAR==2020) |
| 2 | =A1.pivot@r(YEAR,MONTH; CATEGORY, AMOUNT) |
| 3 | =A2.pivot(CATEGORY; MONTH, AMOUNT) |
In logical order, use the function A.pivot@r()to convert the column to row first, and then use the function A.pivot() to convert the row to column.
SPL Official Website 👉 https://www.scudata.com
SPL Feedback and Help 👉 https://www.reddit.com/r/esProc_SPL
SPL Learning Material 👉 https://c.scudata.com
SPL Source Code and Package 👉 https://github.com/SPLWare/esProc
Discord 👉 https://discord.gg/cFTcUNs7
Youtube 👉 https://www.youtube.com/@esProc_SPL


Chinese version