

Excel Get the max and min values of each column in each group and insert them into cells horizontally
In the following table, the 1st column is the grouping column and there are N detail data columns after it.
A |
B |
C |
D |
|
1 |
Z |
N_1 |
N_2 |
Q_12 |
2 |
A |
100 |
200 |
-100 |
3 |
A |
101 |
-10 |
-200 |
4 |
A |
102 |
201 |
-104 |
5 |
A |
99 |
199 |
300 |
6 |
B |
1000 |
1100 |
1300 |
7 |
B |
1004 |
1200 |
-900 |
8 |
C |
2000 |
-2100 |
2200 |
9 |
C |
1900 |
-2090 |
-2180 |
The computing task: group rows by the 1st column; insert the maximum value and the minimum value of each column in each group in order into the 2N columns horizontally.
A |
B |
C |
D |
E |
F |
G |
|
1 |
Z |
N_1Max |
N_1Min |
N_2Max |
N_2Min |
Q_12Max |
Q_12Min |
2 |
A |
102 |
99 |
201 |
-10 |
300 |
-200 |
3 |
B |
1004 |
1000 |
1200 |
1100 |
1300 |
-900 |
4 |
C |
2000 |
1900 |
-2090 |
-2100 |
2200 |
-2180 |
Use SPL XLL to enter the following formula:
=spl("=f=(d=E(?)).fname().m(2:),d.groups(Z;${f.( replace( ""max(*):*Max,min(*):*Min"", ""*"", ~ )).concat@c()})",A1:D9)
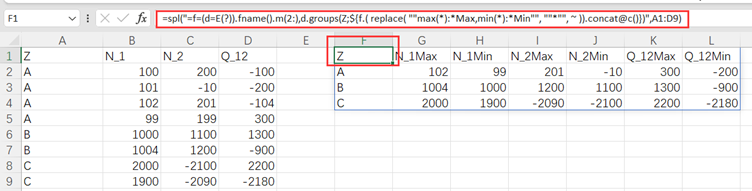
fname()function gets column names of the table. groups() function groups the rows and perform aggregations. m(:2) gets members from the 2nd to the last, and ~ represents the current members. ${} takes the string as a dynamical code to execute.
SPL Official Website 👉 https://www.scudata.com
SPL Feedback and Help 👉 https://www.reddit.com/r/esProc_Desktop/
SPL Learning Material 👉 https://c.scudata.com
Discord 👉 https://discord.gg/cFTcUNs7
Youtube 👉 https://www.youtube.com/@esProcDesktop
Linkedin Group 👉 https://www.linkedin.com/groups/14419406/