YModel practice: How to use historical data to improve marketing success rate
1. Prepare historical data
In the marketing scenario, the target to be predicted is the customer’s purchase behavior. It is necessary to collect some information fields that may affect the purchase behavior, such as the customer’s age, education background, job, income, family structure, living habits, shopping preferences, as well as the product characteristics and promotion efforts. The more relevant information is collected, the better the prediction effect will be.
In addition, we can also make prediction by region or customer group according to business characteristics. For example, the house price in New York is totally different from that in central and southern cities. For another example, in car sales scenario, male customers usually focus on performance, while female customers pay more attention to appearance, and the demand characteristics of high-end customers and mid- and low-end customers will also be quite different. In many cases, analyzing and predicting by customer group is more effective and targeted than predicting directly by all customers.
If the prediction is made by region or customer group, several corresponding wide tables should be prepared. For example, if the prediction is made by three customer groups, three sets of wide tables should be prepared accordingly.
2. Build the model
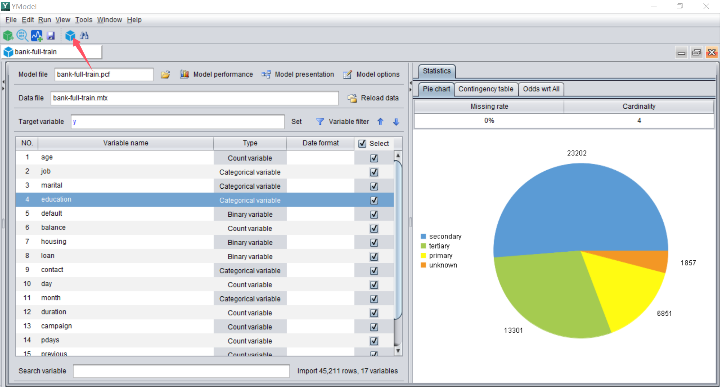
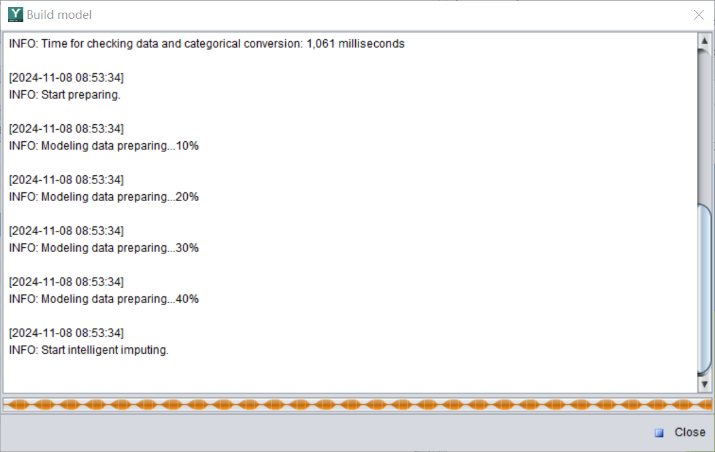
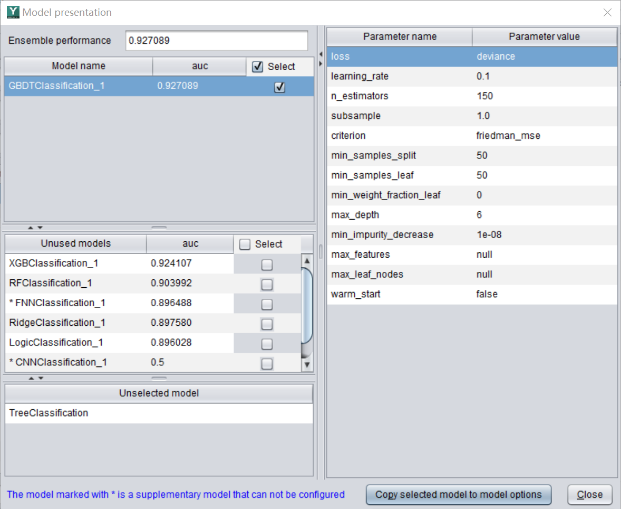
Once the wide table is ready, import it in YModel, and build the model automatically. If there are multiple customer groups, multiple models need to be built.
3. Predict customers’ purchase list
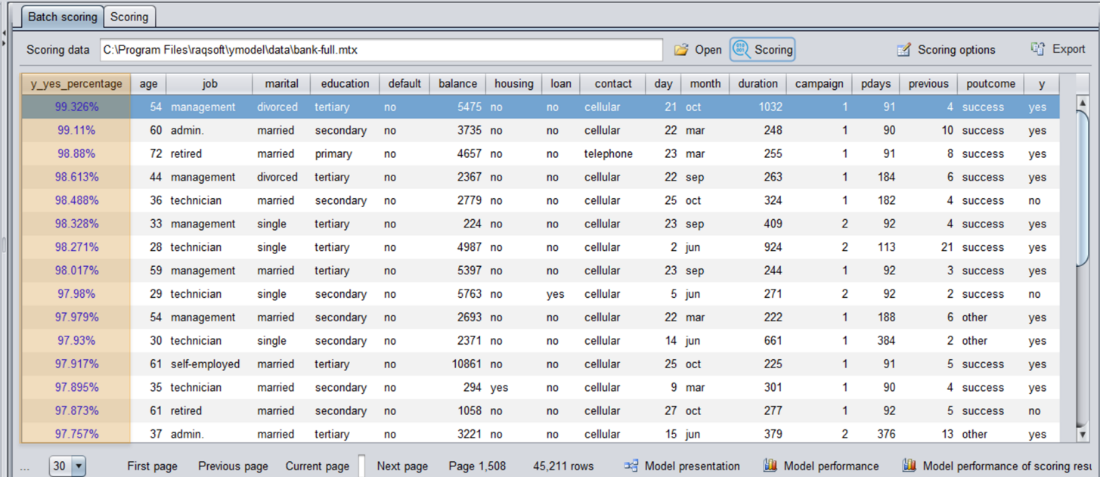
After building the model, perform prediction and get the prediction results. Then sort the probability results from high to low. The higher the ranking of customers, the higher the marketing success rate.
4. Learn to use Lift curve
In the marketing scenario, besides using the AUC indicator to view the accuracy, there is also a very practical evaluation method called lift curve. Lift refers to the lift index, which represents the ratio between the results obtained with and without a predictive model. As shown in the figure below, the abscissa represents the percentage of predicted probabilities sorted from high to low, with 10, 20... representing the top 10%, 20%... of customers respectively, and the ordinate represents the corresponding lift index in the ranking stage.
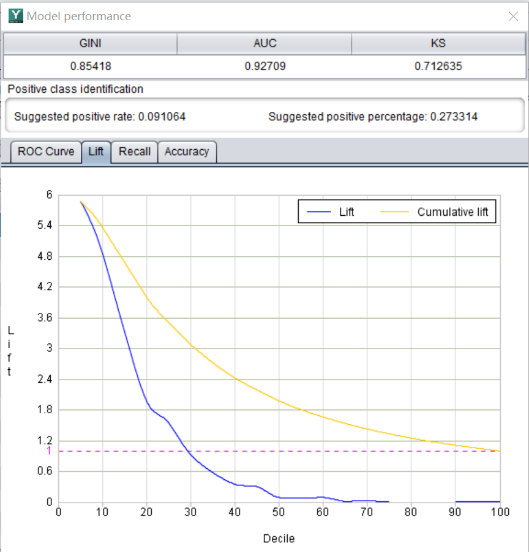
For example, the benchmark purchase rate for a certain product is 1.5%, which means that if customers are selected randomly for marketing, an average of 1.5 people out of every 100 people will purchase the product.
After modeling, the lift curve is as shown in the figure.
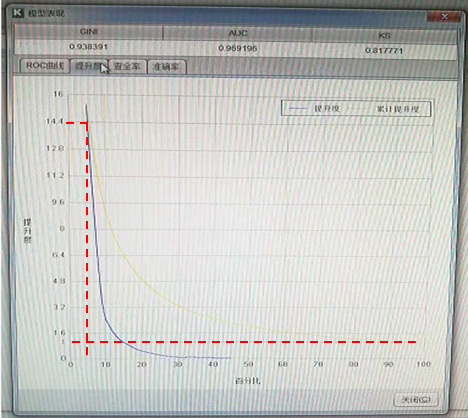
It can be seen that the lift for the top 5% of the data is 14.4, which means that an average of 1.5*14.4=21.6 out of 100 people will buy the product. That is to say, the success rate of marketing to the top 5% of customers can be 14.4 times higher than that of marketing to randomly selected customers.
As the percentage of customers on the abscissa increases, the lift value exhibits a decreasing trend, and the importance of corresponding customers also decreases. When it drops to a certain segment, there is little marketing significance. In this figure, for the top approximately 15% of customers, the lift value is greater than 1, indicating that the success rate of marketing to the top 15% of customers is higher than that of marketing to randomly selected customers.
According to the Lift curve, we can decide what percentage of customers in the probability ranking should be selected for marketing. The steeper the lift curve, the better the ability of the model to select high-quality customers. For example, the lift curve in this figure is a good model, which can help us find the target customers more effectively, thereby finding the most promising potential customers at the lowest cost.
If you have only one or a few products to predict, there is no need to read the content below, because the above methods are enough.
5. Multi-product portfolio purchase list
If you need to sell many kinds of products, such as a dozen or even hundreds, you can further improve the marketing value by mining customers’ preferences and recommending a product portfolio to them. For example, banks may have dozens of financial products to market, home appliance companies may have a variety of home appliances to sell, supermarkets or e-commerce companies may have various products to sell, and insurance companies may have various types of insurance products to market, etc.
The classic case of beer and diapers in history is the result of data mining, which combines two seemingly unrelated products for joint sales, thus increasing the sales of both products. There are many kinds of financial products in banks, so we can combine several products with high purchase probability to sell by mining customers’ purchase preferences.
YModel also offers a related function, allowing us to predict a multi-product portfolio purchase list.
First, we need to prepare a wide table with multiple targets and put the historical information and target variables required for product prediction into the same wide table.
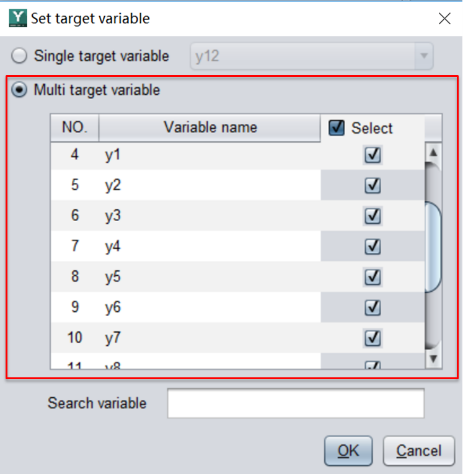
Unlike the previous single-target prediction scenarios, there are multiple target variables in this wide table, namely y1, y2, y3..., representing the historical data on whether or not each product was purchased.

Then, when configuring the target variable, change the single target variable to multi target variables, as shown in the figure below.
YModel will automatically combine products based on customer preferences.
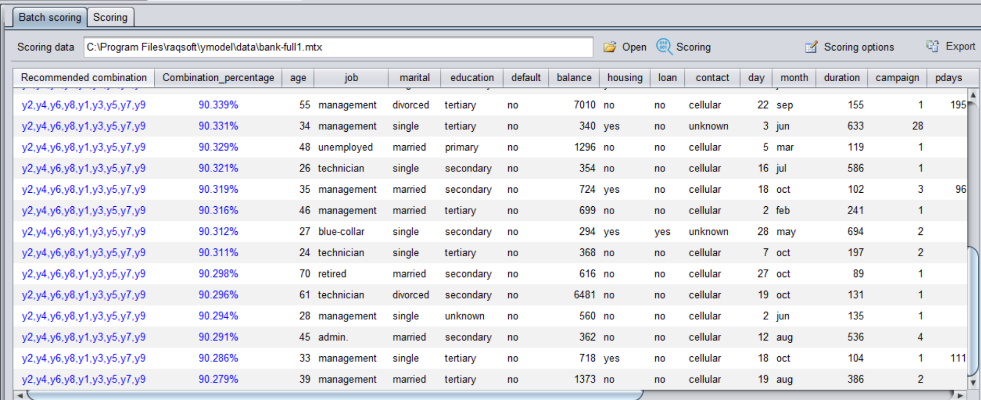
Now it's just a matter of performing automatic modeling. The operation steps are the same as those for single product modeling. After the prediction is done, the results similar to the following figure will appear.
The first column on the left contains the product portfolio information, and the second column is the probability that the customer will buy the portfolio.
Once the results are exported, a product portfolio purchase list is generated, enabling us to conduct targeted marketing activities on customers with higher purchase probability.
SPL Official Website 👉 https://www.scudata.com
SPL Feedback and Help 👉 https://www.reddit.com/r/esProcSPL
SPL Learning Material 👉 https://c.scudata.com
SPL Source Code and Package 👉 https://github.com/SPLWare/esProc
Discord 👉 https://discord.gg/2bkGwqTj
Youtube 👉 https://www.youtube.com/@esProc_SPL


