Data Analysis Programming from SQL to SPL: Population and Language Analysis
Data structure
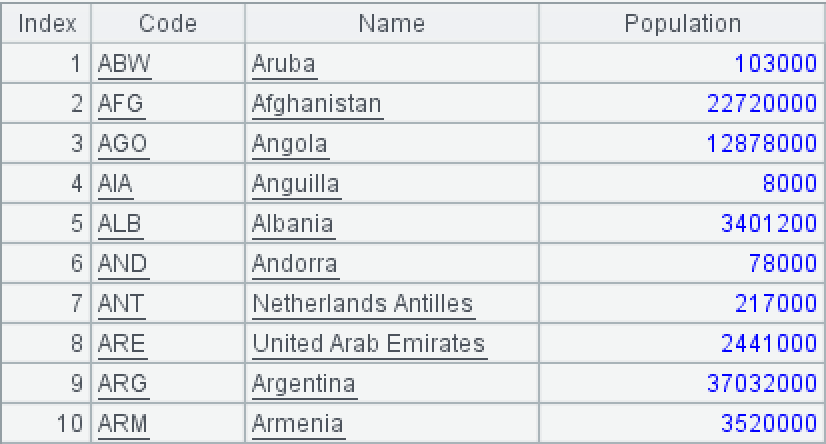
Country table world.country:

Code is the country code; Name is the country name; Population is the country population.
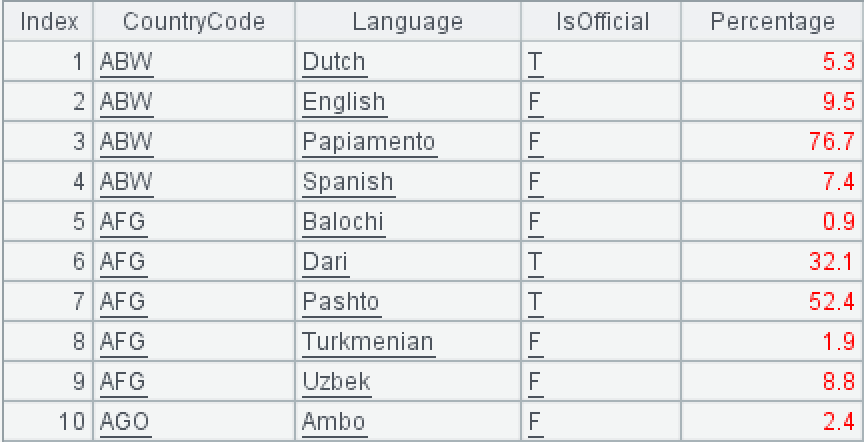
Country language table world.countrylanguage:

CountryCode is the country code; Language is the language; IsOfficial is whether it is an official language (T represents an official language); Percentage is the percentage of the population using the language.
1. Query for the country with the most official languages, its population, and the number of official languages
It can be seen from the example data that each country may use multiple languages, including both official and non-official languages.
SQL statement:
with t1 as (
    select CountryCode, count(*) Num
    from world.countrylanguage
    where isOfficial='T'
    group by CountryCode),
t2 as (
    select *
    from t1
    where Num=(select Max(Num) from t1))
select Name,Population,Num
    from world.country c join t2
    on c.Code=t2.CountryCode;
While the window function is used, the SQL statement still needs to nest multiple layers of code, which is a bit cumbersome. This is mainly because SQL’s grouping function always appears together with aggregation, and the aggregation functions it supports are limited.
This problem is actually very simple. We just need to group the country language table by country and select all records from the group with the most languages, and then find the name and population of the corresponding country from the country table.
SPL supports independent grouping operations, which facilitates step-by-step calculations. Moreover, SPL offers more aggregation methods. SPL script:
A |
|
1 |
=T("country.txt") |
2 |
=T("countrylanguage.txt").select(IsOfficial=="T") |
3 |
=A2.group(CountryCode;count(~):Num).maxp@a(Num) |
4 |
=A3.switch(CountryCode,A1:Code).new(CountryCode.Name,CountryCode.Population,Num) |
A1: Read the country table.
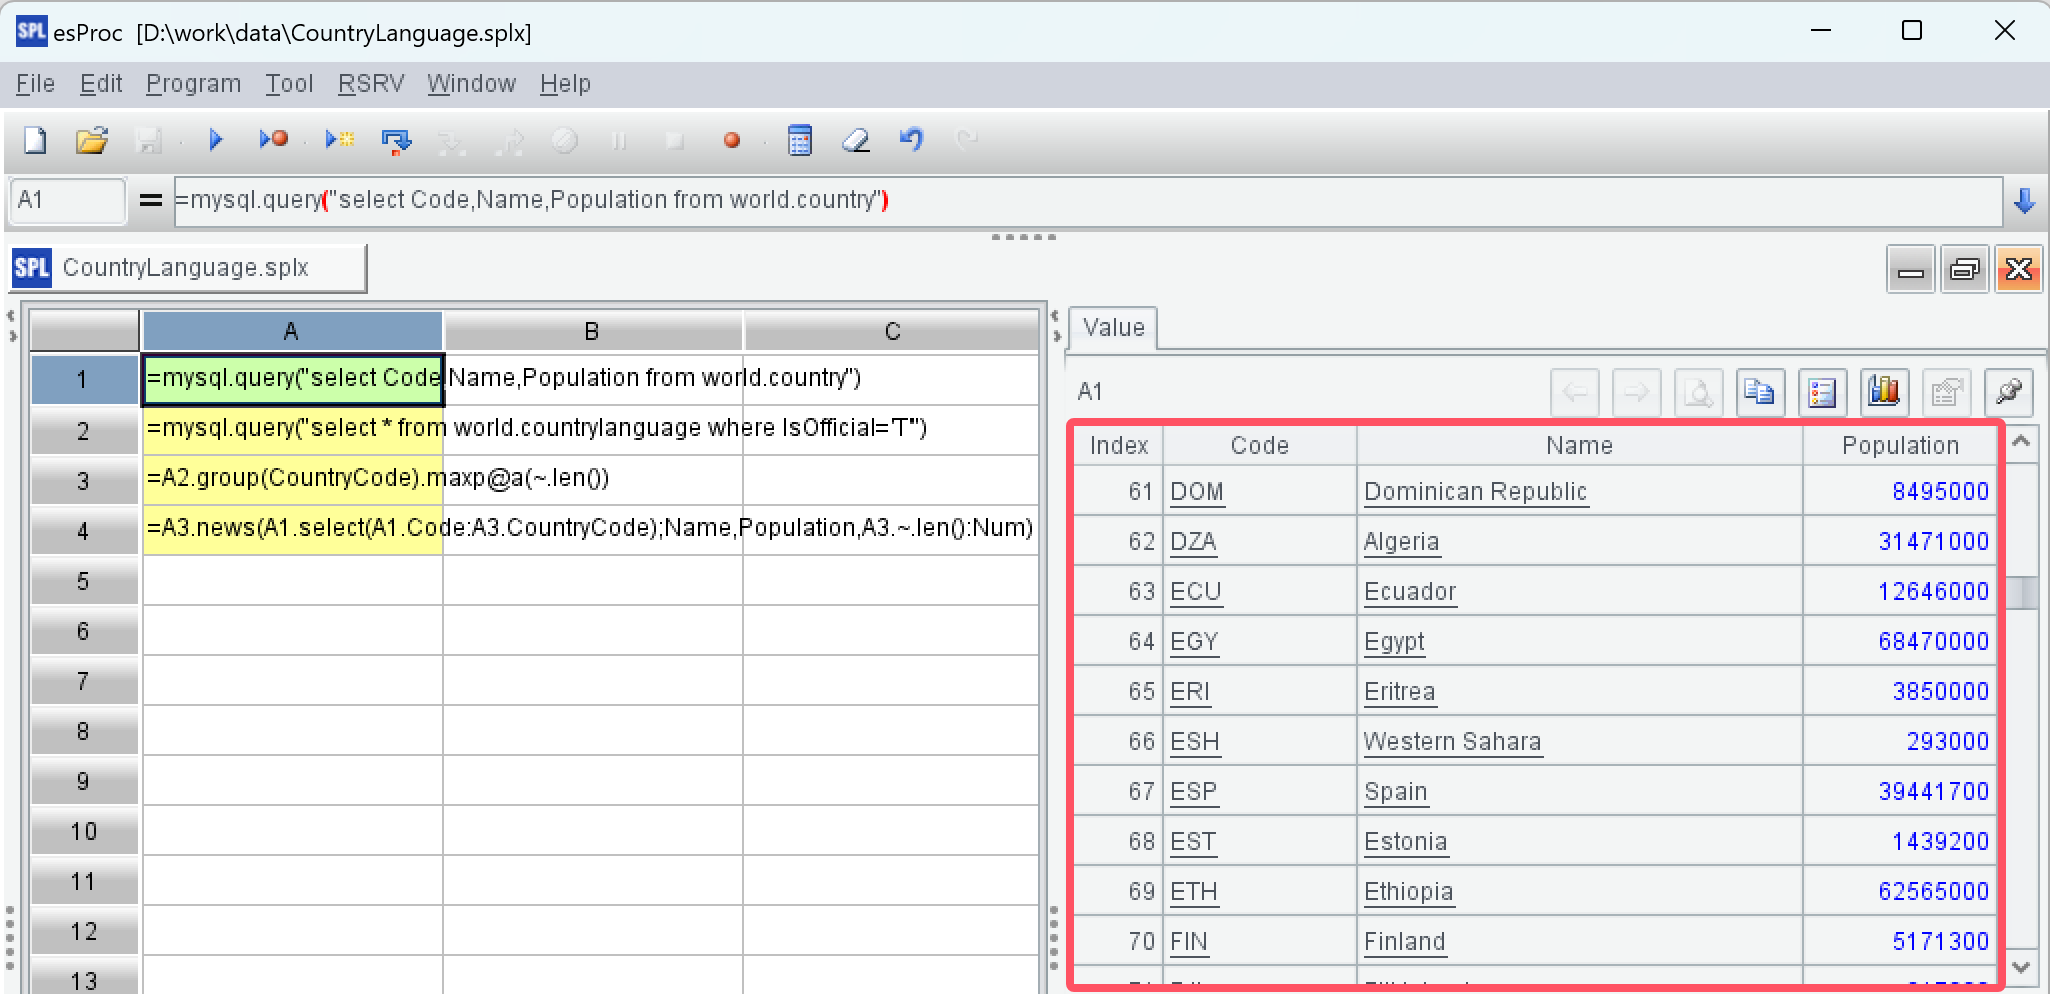
SPL IDE is highly interactive, allowing for intuitively viewing the results of each step in the right-hand value panel after execution.

A2: Read the country language table and select the official languages.
A3: Group by CountryCode and extract the records from all groups with the most members. There may be multiple countries with the most official languages. The function maxp here uses the option @a to return all members that maximize the value of the calculation expression.
When clicking on A3 in IDE, you can see that two results are selected:

A4: Objectify the foreign key CountryCode of A3 and construct the required target structure.
First, convert the country code to the corresponding country record:

Double-clicking on a country code allows you to view the corresponding country record.

Then construct the target structure:

2. Query for the country with the most official languages, its population, and the most used official language and corresponding population ratio
This problem has one more step than the previous one. It requires selecting the most used official language.
SQL statement:
with t1 as (
    select CountryCode, count(*) Num,
    RANK()OVER (ORDER BY COUNT(*) DESC) AS rk
    from world.countrylanguage
    where isOfficial='T'
    group by CountryCode),
t2 as (
    select *
    from t1
    where rk=1),
t3 as (
    select cl.CountryCode, Language, Percentage
    from world.countrylanguage cl join t2
    on cl.CountryCode=t2.CountryCode),
t4 as (
    select CountryCode, max(Percentage) MaxP
    from t3
    group by CountryCode),
t5 as (
    select t3.CountryCode, t3.Language, t3.Percentage
    from t3 join t4
    on t3.CountryCode=t4.CountryCode and t3.Percentage=t4.MaxP)
select c.Name,c.Population,t5.Language,t5.Percentage
    from world.country c join t5
    on c.Code=t5.CountryCode;
Although it only adds one more step, that is, select the maximum value, the complexity of the SQL statement has increased significantly. This is mainly because SQL’s grouping function always appears together with aggregation, making it impossible to retain the grouped subset for further calculations.
For SPL, we can still follow the natural logic, just need to select the most used official language based on problem 1:
A |
|
1 |
=T("country.txt") |
2 |
=T("countrylanguage.txt").select(IsOfficial=="T") |
3 |
=A2.group(CountryCode).maxp@a(~.len()).(~.maxp(Percentage)) |
4 |
=A3.switch(CountryCode,A1:Code).new(CountryCode.Name,CountryCode.Population,Language,Percentage) |
A1/A2: Read the country table and country language table, and select the official languages.
A3: Group by CountryCode, select the group with the most elements, and then search for the record with the maximum ratio in each group.

A4: Objectify the foreign key CountryCode of A3 and construct the required target structure.

Compared with the SPL script for problem 1, this one is not much more complex. This is mainly due to the fact that SPL supports independent grouping operations and retains grouped subsets after grouping, which allows you to continue to use the grouped subsets for various operations when you want to select the most diverse and used language later.
3. Sort the official languages of the country with the most official languages and their usage ratios on the same row in descending order
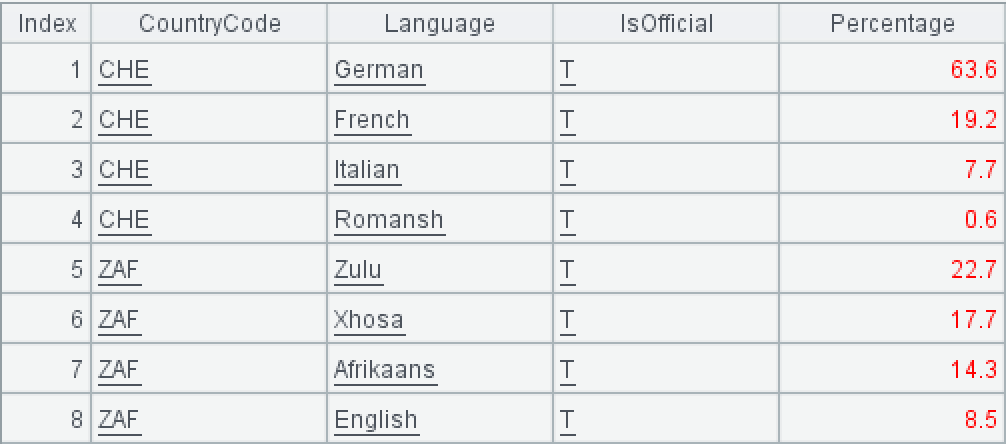
The expected target result set is as follows:

It can be seen that the target data structure is calculated from data and is not fixed. Ordinary SQL cannot solve this problem, requiring the use of dynamic SQL, which is cumbersome to implement. Therefore, the SQL solution will not be given here.
Using SPL to solve this problem is still not complex. We just need to sort the countries with the most official languages by usage ratio based on problem 1 and then construct the target data structure:
A |
|
1 |
=T("countrylanguage.txt").select(IsOfficial=="T") |
2 |
=A1.group(CountryCode).maxp@a(~.len()).conj().sort(CountryCode,-Percentage) |
3 |
=A2.groupc(CountryCode;Language,Percentage) |
4 |
>A3.rename(${(A3.fno()\2).("#"/(2*#)/":Language"/#/",#"/(2*#+1)/":Percentage"/#).concat@c()}) |
A1: Read the country language table and select the official languages.
A2: Group by CountryCode and extract the records from all groups with the most members. Then, concatenate these records into a sequence and sort them by country code and usage ratio, with the usage ratio in descending order.

A3: Consolidate records with the same country code, placing all languages and usage ratios on the same row. Here we use the groupc function to perform row-column conversion calculation on the sequence of sequences.

A4: Change the names of the second and subsequent columns in A3 to Languagei and Percentagei respectively:

Data file attachments:
SPL Official Website 👉 https://www.scudata.com
SPL Feedback and Help 👉 https://www.reddit.com/r/esProcSPL
SPL Learning Material 👉 https://c.scudata.com
SPL Source Code and Package 👉 https://github.com/SPLWare/esProc
Discord 👉 https://discord.gg/2bkGwqTj
Youtube 👉 https://www.youtube.com/@esProc_SPL


Chinese version