Interactive Data Analysis from Excel to SPL: Basic Marketing Analysis
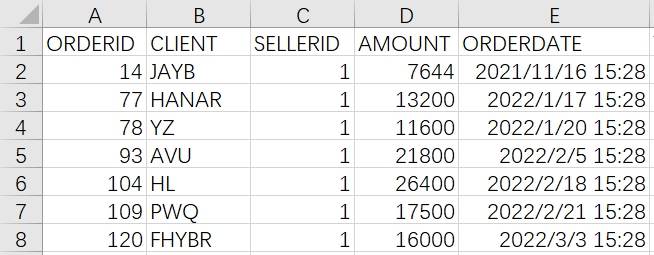
The order data table records sales order information for the past few years.
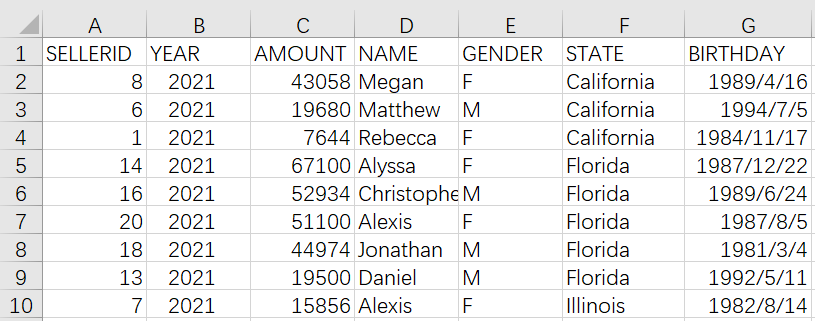
The employee information table records basic information for all employees.

1. Aggregate and join into a wide table
Aggregate the original order data by year. Then, join it with the employee information table to create a table like the one below for further data analysis.
In Excel, multiple steps need to be performed manually.
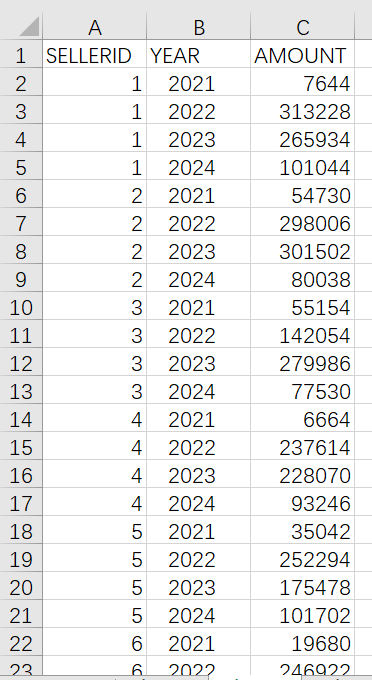
(1) Summarize the annual sales of each salesperson.
Since there is no year in the original order data, only the order date, it needs to use the YEAR() function to extract year.

Then use the PivotTable to summarize each person’s annual sales:
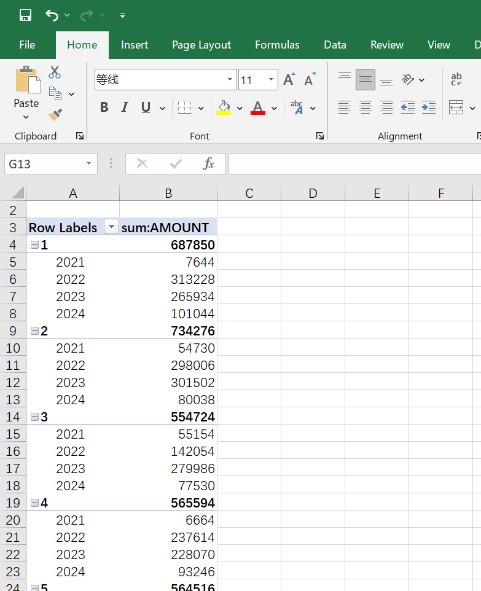
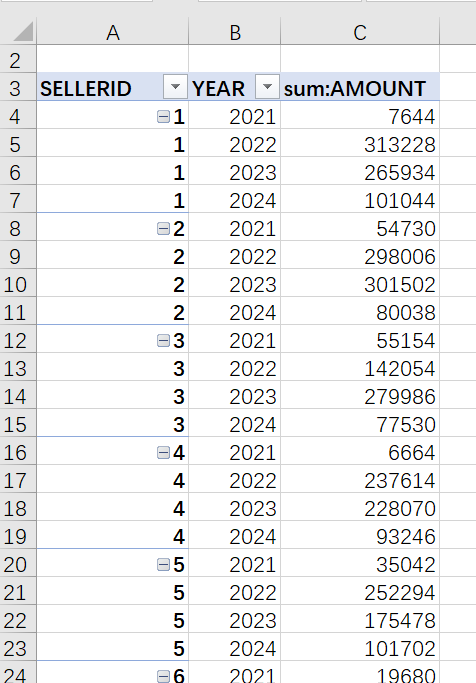
Many analysis calculations need to be performed later, but these cannot be operated directly on the pivot table, therefore the data must be manually copied and pasted out.
(2) Associate the aggregated data with the relevant information in the employee table.
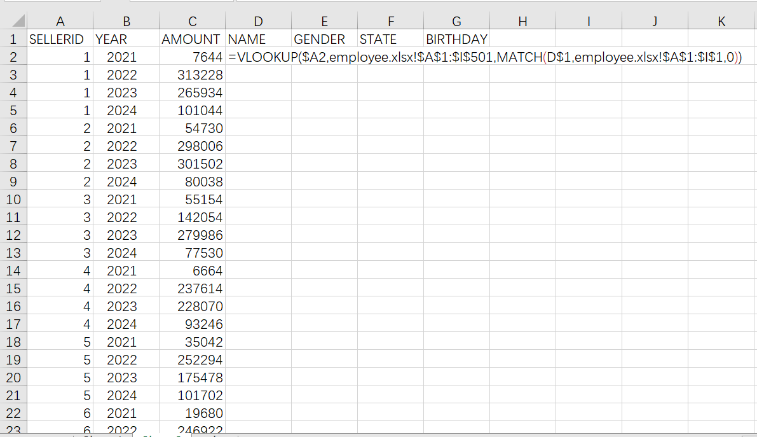
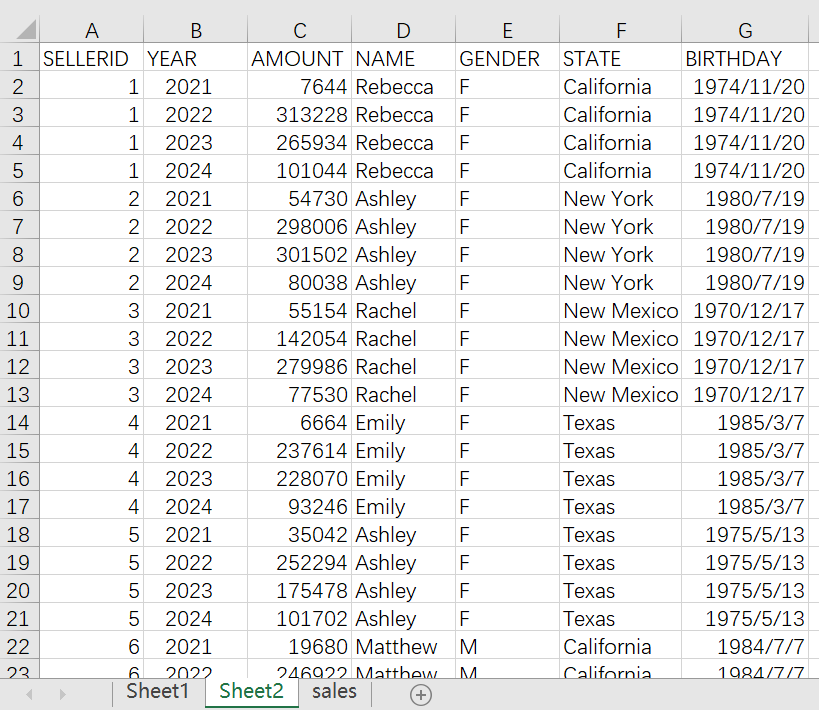
In Excel, VLOOKUP needs to be used to associate:
Enter the following into cell D1:
=VLOOKUP($A2,employee.xlsx!$A$1:$I$501,MATCH(D$1,employee.xlsx!$A$1:$I$1,0))
Then drag the formula.
The Excel formula is somewhat complicated, and dragging it requires considering the lock of the row or column in the parameters, making it prone to errors.
In addition, VLOOKUP can only perform association on a single column. If associating on SELLERID and YEAR, using VLOOKUP would be much more complicated.
In contrast, the process of writing SPL code is much clearer, though it also involves multiple steps:
A |
B |
|
1 |
=file("sales.csv").import@t() |
=file("employee.csv").import@t() |
2 |
=A1.groups(SELLERID,year(ORDERDATE):YEAR;sum(AMOUNT):AMOUNT) |
|
3 |
=A2.join(SELLERID,B1:EID,NAME,GENDER,STATE,BIRTHDAY) |
|
SPL is a programming language, but its code looks similar to Excel’s. It also writes formula in cell and can reference cell value.
Cells A1 and B1 import the order data table and employee information table respectively.
SPL is highly interactive, allowing for viewing the results of each step in real time. Clicking on cell A1 can display its data on the right side of the interface.
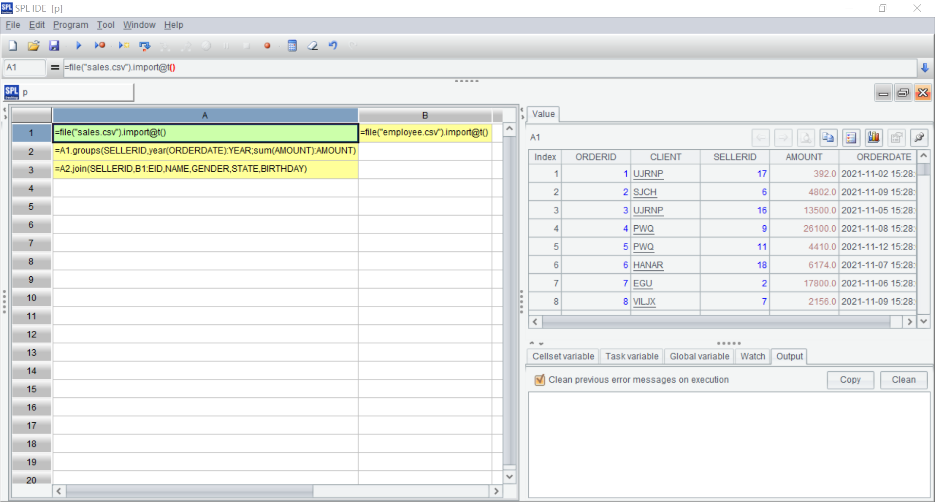
A2: Group and aggregate sales by SELLERID and YEAR to obtain the annual sales for each salesperson. The groups function is the grouping and aggregating function.
A3: Associate the employee table to the aggregated order data on the ID number. The join function is an association function. It’s easy to use; just enter the association conditions and the column names to return. One association can return multiple column values, and multi-column association is also supported.
Once the program code is finished, it only needs to be executed again when the source data changes, thus avoiding repetitive operations.
2. Find female salespeople under 40 years old and calculate their average annual sales
Since there is no age in the original data, it needs to calculate the age based on birthday.
Excel can use DATEDIF function to calculate the difference between the current date and the birthday to obtain the age.
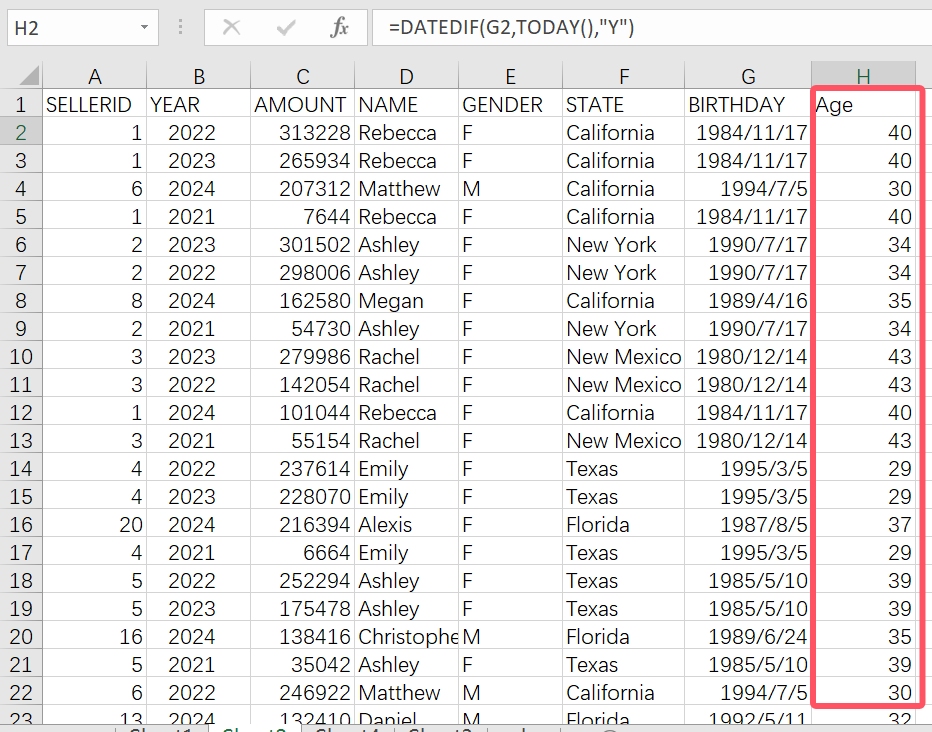
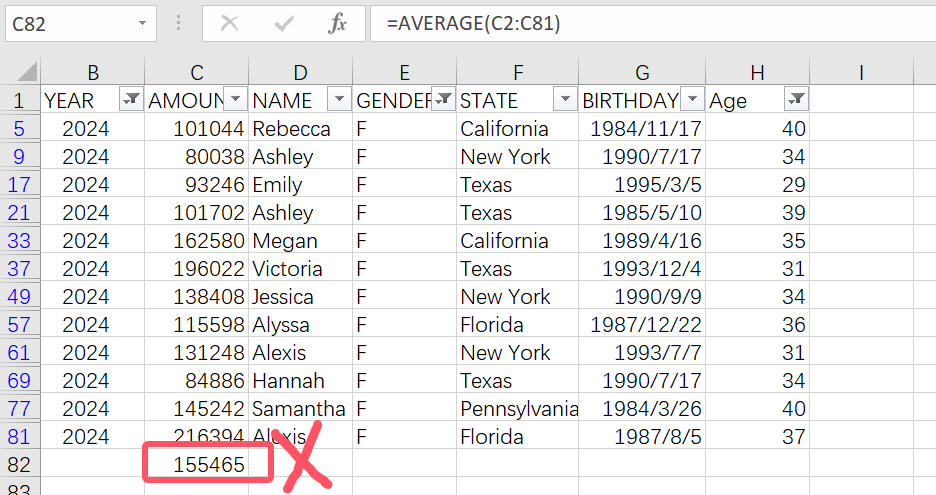
Then, apply the filter menu to select the sales data for female salespeople under 40 in 2024.

When calculating average sales, we cannot calculate directly on the filtered data, we have to copy it out before calculation.
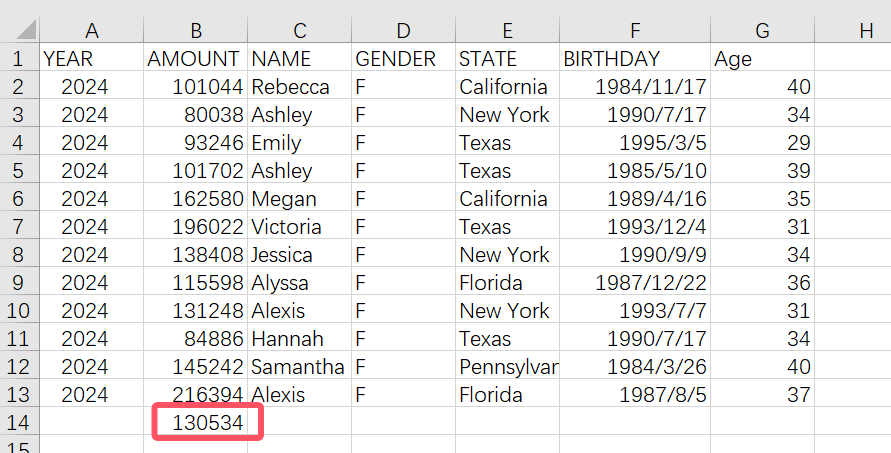
SPL can continue to process based on the previous task:
A |
|
… |
… |
4 |
=A3.select(YEAR==2024 && age(date(BIRTHDAY))<=40 && GENDER=="F") |
5 |
=A4.avg(AMOUNT) |
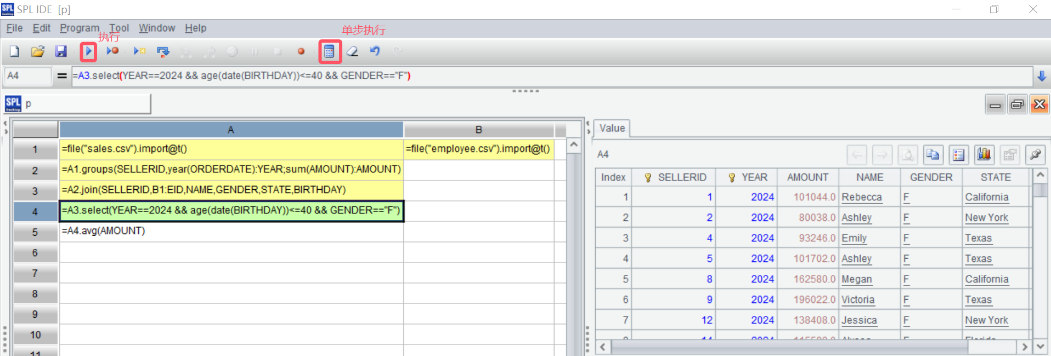
A4: Utilize the select function to filter and write conditions to select orders completed by female salespeople under the age of 40 and in the year 2024. The age can be calculated dynamically.
A5: Calculate average sales.
SPL IDE supports the execution of a single statement. The first three lines of code have already been executed. Here we only need to execute A4 and A5 separately.
3. Find the sales champions from the past few years
Use Excel to sort the data by YEAR and AMOUNT, and we can see the sales champion for each year. However, extracting these champions is not easy. We either have to manually copy them, or add an in-group counting column and then filter, which are both quite troublesome. It becomes even more complicated when there are tied champions.
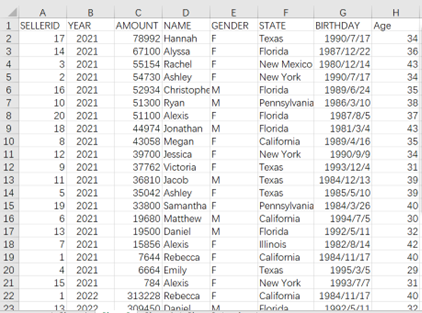
The maxp function of SPL can extract the entire data corresponding to the maximum sales. By grouping by YEAR, we can obtain the sales champion for each year, and this can be further calculated based on the A3 completed in Task 1:
A |
|
… |
… |
4 |
=A3.groups(YEAR;maxp(AMOUNT):m) |
5 |
=A4.(m) |
In SPL, there are richer aggregation operations. For example, it offers max() to get the maximum value, pmax to get the position of the maximum value, and maxp to get the entire row of data where the maximum value is located. These features are not available in Excel.
Then, A5 can extract the aggregated results for each group.
If there’s a possibility of tied champions, adding the option @a to the maxp function can return the data of all rows corresponding to the maximum values.
A |
|
… |
… |
4 |
=A3.groups(YEAR;maxp@a(AMOUNT):m) |
5 |
=A4.conj(m) |
map@a will return a set, which needs to be merged using the conj function in A5.
4. Find the top three salespeople in each state for the year
Use Excel to select the 2024 data first.
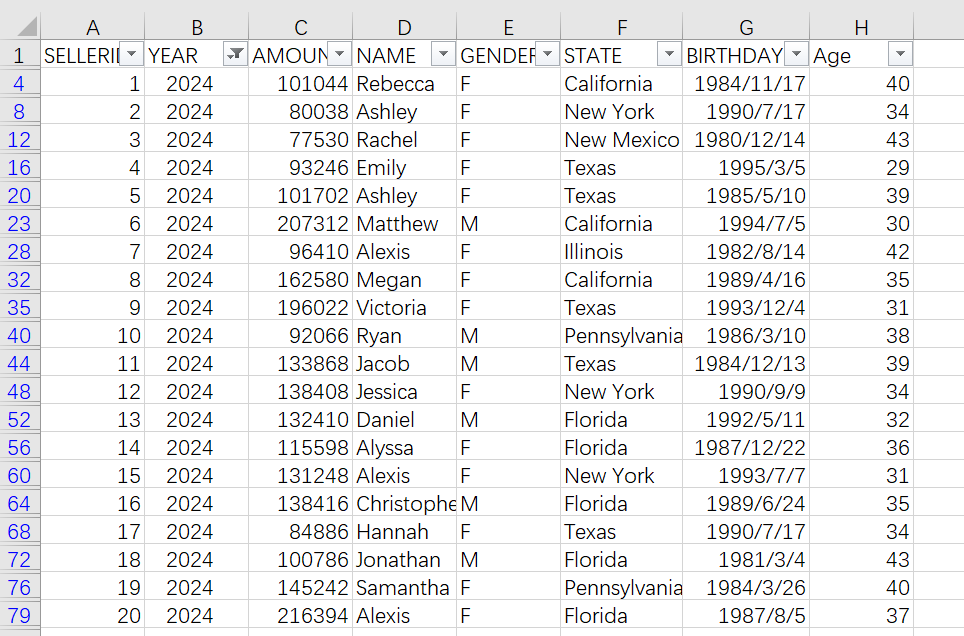
Then, similar to the previous task, sort by STATE and AMOUNT to obtain the sales ranking for each state.
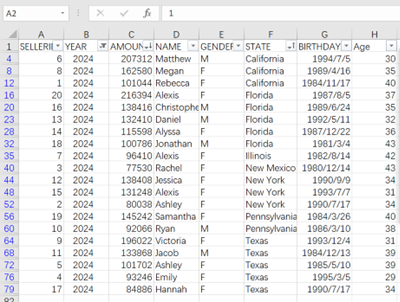
The top 3 salespeople in each state are visible, but manual copying is typically required. When the amount of data is large, it’s necessary to add an auxiliary counting column, otherwise, it’s too cumbersome.
SPL, similar to Task 3, continue to calculate based on A3 in Task 1, but use a different aggregate function:
A |
|
… |
… |
4 |
=A3.select(YEAR==2024).groups(STATE;top(-3;AMOUNT):top3).conj(top3) |
Use select to select the 2024 data, then use the groups() function to group by state, and take the top 3 sales data in each group.
The top here is also an aggregate function, which will return a small set, i.e., the top three members. Similarly, the conj function is used here for merging.
SPL Official Website 👉 https://www.scudata.com
SPL Feedback and Help 👉 https://www.reddit.com/r/esProcSPL
SPL Learning Material 👉 https://c.scudata.com
SPL Source Code and Package 👉 https://github.com/SPLWare/esProc
Discord 👉 https://discord.gg/2bkGwqTj
Youtube 👉 https://www.youtube.com/@esProc_SPL


