Data Analysis Programming from SQL to SPL: Stock Rise Analysis
Data structure and sample data:
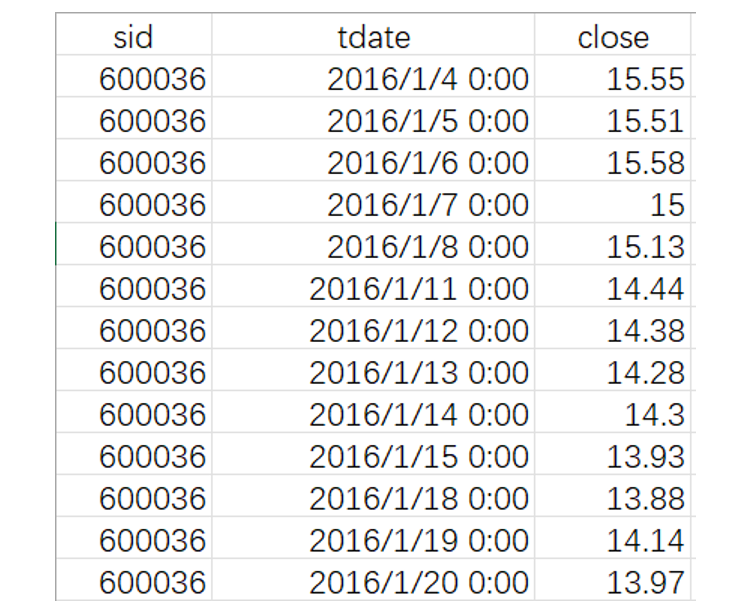
In which, sid is the stock code, tdate is the transaction date, and close is the closing price.
1. Find the stock price crossing above its median
The median stock price on day T refers to the median of the closing prices from the listing date to day T.
The stock price crossing above its median on day T means that the closing price on day T is greater than the median on day T, and the closing price on day T-1 is less than the median on day T-1, or the closing price on day T-1 is equal to the median but the closing price on day T-2 is less than the median, and this pattern continues for prior days.
Now, we want to find the trading dates, closing prices, and median stock prices of the day when stock 600036 meets the condition of the stock price crossing above its median.
Take MySQL database as an example to write SQL code:
with tbl1 as (
    select *
    from stock
    where sid='600036'
),
tbl2 as (
    select t1.*, t2.close pclose,
        count(*) over(partition by t1.sid,t1.tdate) cnt,
	    row_number() over(partition by t1.sid,t1.tdate order by t2.close) r
    from tbl1 t1 join tbl1 t2
        on t1.sid=t2.sid  and t1.tdate>=t2.tdate
),
tbl3 as (
    select sid,tdate,max(close) close, avg(pclose) median
    from tbl2
    where rn=floor((cnt+1)/2) or rn=floor((cnt+2)/2)
    group by sid,tdate
),
tbl4 as (
    select sid,tdate, close, median,
    close>median and
        lag(close) over(partition by sid order by tdate)
        < lag(median) over(partition by sid order by tdate)  flag
    from tbl3
    where median!=close
)
    select tdate, close, median
    from tbl4
    where flag=1;
Due to the lack of a direct median function in MySQL, we have to first manually generate a sequence numberr, and then utilize r as a condition in the outer query to retrieve the median-related records. This results in substantially more complex SQL code.
Some databases (like Oracle) provide the median function, which makes the SQL code a little simpler. However, a four-level subquery, along with window functions, is still required to perform the calculation.
with tbl1 as (
    select t1.sid,t1.tdate,t1.close,
        (select median(close)
         from stock
         where t1.sid=sid  and t1.tdate>=tdate
        ) median
    from stock t1
    where t1.sid=600036
),
tbl2 as (
    select sid,tdate, close, median ,
        lag(close) over(partition by sid order by tdate) as pclose,
        lag(median) over(partition by sid order by tdate) as pmedian
    from tbl1
    where close!=median
)
    select tdate, close, median
    from tbl2
    where close>median and pclose<pmedian;
To calculate the median stock price on day T, it needs to find the set of closing prices from the listing date to day T. Whether it’s the join operation employed in the first SQL code, or the subquery utilized in the second, both are quite convoluted.
A more natural approach is to sort the stock’s data by trading date. Then, constitute the set consisting ofclosevalues from the first record up to day T (e.g., January 15, 2016), that is, the target set corresponding to day T.
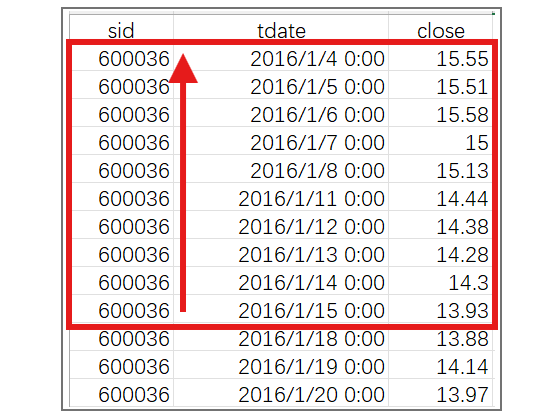
However, SQL is not thoroughly set-lized, lacking the method to represent detached records and their sets. It cannot use members of the original set to form a new set for calculation. This makes it impossible to implement this approach, so it has to use joins or subqueries.
In comparison, SPL is more thoroughly set-lized and supports ordered sets, making this approach easy to implement.
A |
|
1 |
=T("stktrade.csv").select(sid==600036).sort(tdate) |
2 |
=A1.derive(close[:0].median():median) |
3 |
=A2.select(close!=median).select(close>median && close[-1]<median[-1]) |
A2: The loop function derive supports cross-row referencing, where close[:0] represents the set of close values from the first row of A1 up to the current row. This is exactly the set of all closing prices from the listing date to day T, as described in the approach, and can be obtained without using joins or subqueries.
Moreover, SPL also provides the median function, making it very convenient to calculate the median of the set close[:0].
Likewise, when the cursor is positioned over A2, its calculation result can be seen in the right-hand panel.
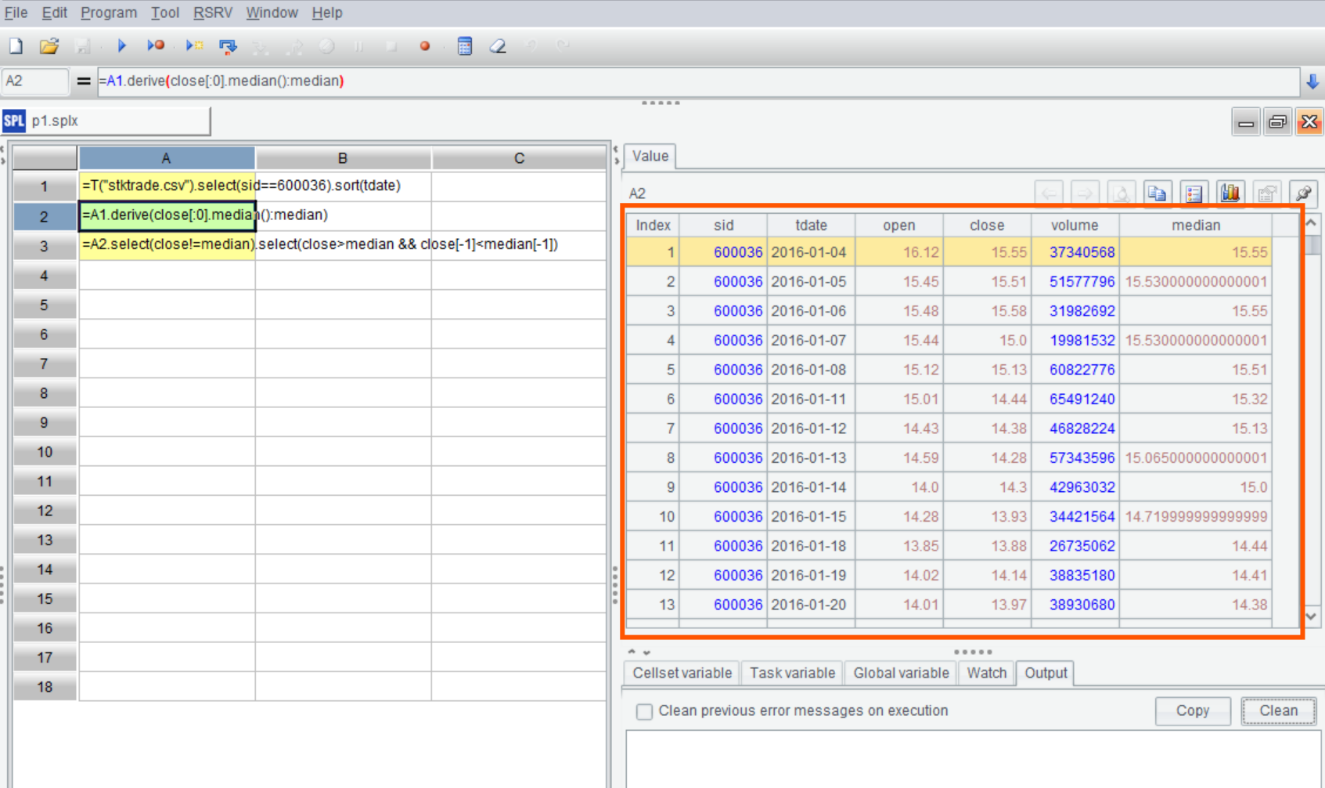
A3: First, filter out records where the closing price equals the median. Then, find the records where the stock price crosses above the median. Cross-row referencing is also employed here, where close[-1]<median[-1] indicates that the closing price of the previous row is less than the corresponding median.
2. Find the upward swings of the specified stock
Requirements for calculating upward swings:
The input parameter is the number of trading days, W;
A swing refers to an interval formed by a continuous sequence of trading days;
A trading day being “a new high within W trading days” means that the closing price of this trading day is higher than the closing prices of all the preceding W-1 trading days.
A trading day being a new low within a swing means that the closing price of this trading day is lower than the closing prices of all earlier trading days within that swing.
A trading day being guaranteed to reach a new high within W days means that within W days after this trading day (inclusive), there will be at least one “new high within W trading days”.
Conditions for an upward swing:
Within a swing, there is at least one trading day that is guaranteed to reach a new high within W trading days;
The swing must start at its lowest price and end at its highest price;
The duration of the swing must be at least W trading days.
Now, given W=5, we want to find the start and end dates for all upward swings of stock 300469.
This calculation requires finding multiple record positions, such as new highs, new lows, start points, and end points. Using SQL for this would involve repeatedly generating sequence numbers and then using conditions to select the desired records. While feasible, the code would be exceedingly convoluted, so SQL code won’t be provided here.
The approach to finding upward swings: sort the stock’s data by trading date and add columns high1 and high2 to mark new highs and guaranteed new highs, respectively. In the first loop calculation, if the current trading day’s closing price is greater than the previous four trading days’ closing prices, set high1 to 1; otherwise, set it to 0. In the second loop calculation, if there’s a record with high1 equal to 1 within the W-1 trading days after the current trading day, set high2 to 1; otherwise, set it to 0. Calculation results:
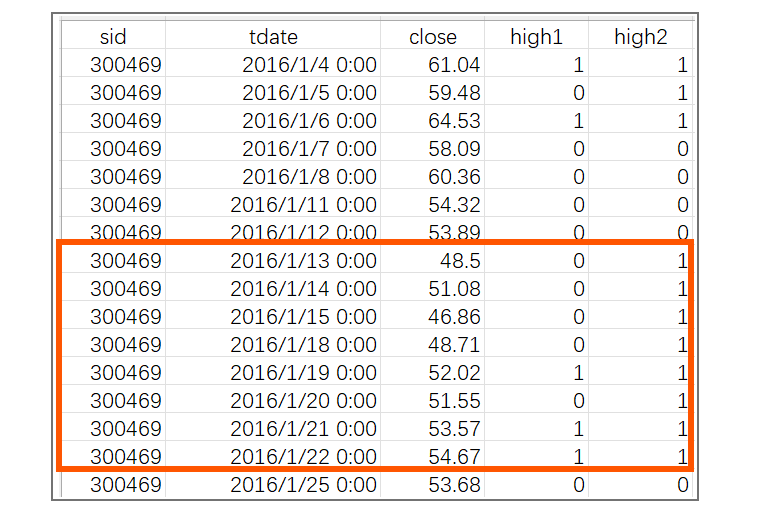
In the results, the intervals where high2 is continuously 1 and the length is >=W represent swings that are guaranteed to have a new high within W days, as shown in the red-boxed section. The next step is to find the target swings among these swings.
If a swing does not contain a new low, then it is a target swing.
If a swing contains a new low, we can find the index y of the first record with high1 equal to 1 before the first new low. If y>=W, then the first y records of this swing are the target swing.
Then, use all the data after the first new low to form a new swing and continue to find target swings using the same method. Repeat this process.
It is evident that this process requires using recursive function. Simple SQL recursive statements cannot implement this, and implementing it with a stored procedure would be very difficult. Therefore, this method is abandoned here.
SPL offers a sequence positioning mechanism and also supports recursive function calls, making it easy to implement this approach.
A |
B |
C |
|
1 |
=T("stktrade.csv") |
>W=5 |
|
2 |
=A1.select(sid==300469 && tdate>=date(2016,01,04) && tdate<=date(2018,10,18)).sort(tdate) |
||
3 |
=A2.derive(if(close[-W+1:-1].max()<close,1,0):high1).derive(high1[0:W-1].max():high2) |
||
4 |
=A3.group@o(high2).select(high2==1 && ~.len()>=W) |
=create(start,end) |
|
5 |
for A4 |
=stockFunc(A5) |
>B5.run(B4.insert(0,B5.~.tdate,B5.~.m(-1).tdate)) |
6 |
|||
7 |
func stockFunc(stockSet) |
=[] |
|
8 |
=stockSet.pselect(close<close[:-1].min()) |
||
9 |
if B9 |
>if(B9>=W,(x=stockSet.to(B9),y=x.pselect@1(high1==1),if(y>=W,B8|=[stockSet.to(y)]))) |
|
10 |
>if(stockSet.len()-B9+1>=W,B8|=stockFunc(stockSet.to(B9,))) |
||
11 |
else |
>if(stockSet && stockSet.len()>=W,B8|=[stockSet]) |
|
12 |
return B8 |
||
A3: Using the cross-row referencing mechanism within the loop function, we can easily calculate the high1 flag (W-day new high) and the high2 flag (guaranteed new high within W days) with just two expressions, following the approach described above.
A4: group@o groups adjacent records, which is equivalent to merging consecutive records with the same high2 while maintaining the original order. Then, filter groups with high2 equal to 1 and length >=W, which are the swings guaranteed a new high within W days.
A5: Loop through A4’s swings, call the subroutine stockFunc to continue searching for upward swings, with the current member of A5 as the subroutine’s parameter. C5 writes the results returned by the subroutine to the result set of B4.
SPL IDE supports stepping into subroutines. When the cursor is on cell B5, where the subroutine is called, you can click the “Step into” button on the menu bar.
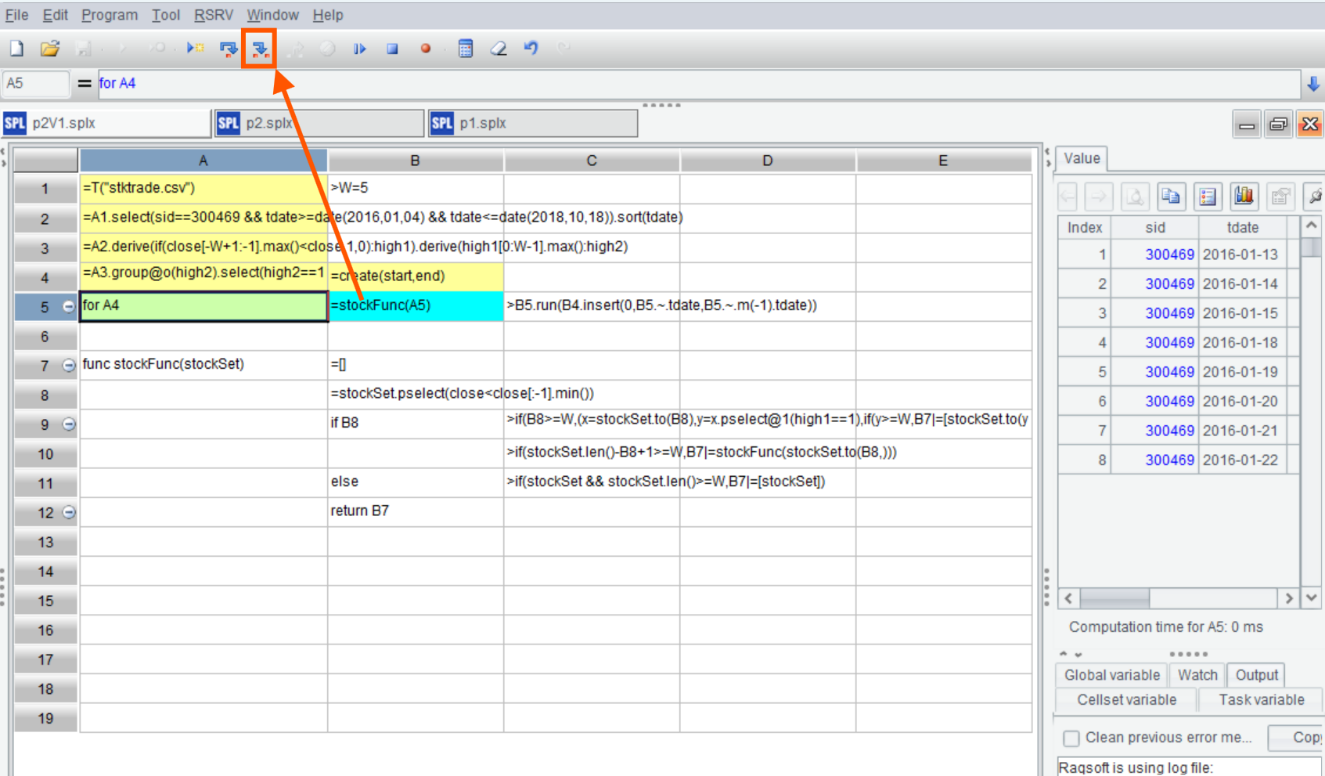
In the subroutine stockFunc, B8 uses the cross-row referencing mechanism to find the positions of new lows in closing prices within the stockSet set.
C9: x and y are temporary variables. x is the set of records before the new low (including the new low), and y is the position of the first record within x where high1 is 1. Following the previous approach, if y>=W, then the first y records in stockSet are a desired swing and added to the result B7.
The calculation results can also be viewed in the preview panel within the subroutine.
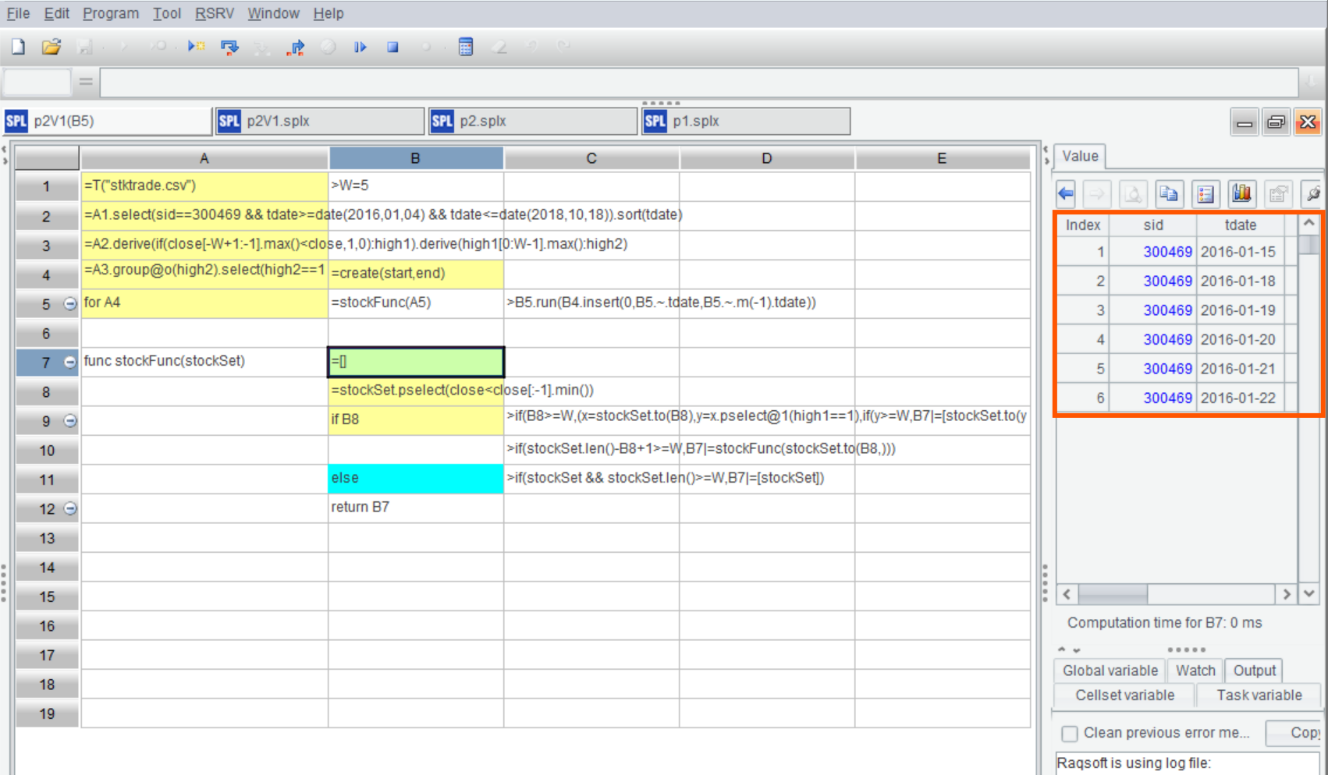
C10: Following the previous approach, use the data after the new low to form a new swing and call stockFunc with this new swing as a parameter to continue searching for target swings. This is a recursive call to the stockFunc subroutine.
C11: If there is no new low and the length is greater than W, then the entire set is a target swing and is added to the result.
SPL Official Website 👉 https://www.scudata.com
SPL Feedback and Help 👉 https://www.reddit.com/r/esProcSPL
SPL Learning Material 👉 https://c.scudata.com
SPL Source Code and Package 👉 https://github.com/SPLWare/esProc
Discord 👉 https://discord.gg/2bkGwqTj
Youtube 👉 https://www.youtube.com/@esProc_SPL


Chinese version
Click here to download the data file