Interactive Data Analysis from Excel to SPL: Advanced Marketing Analysis
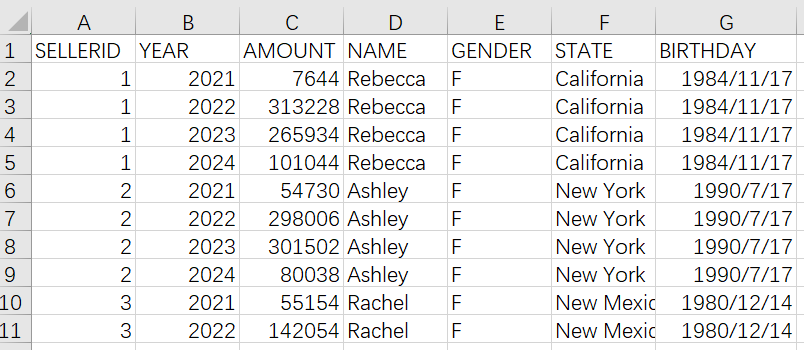
There is a sales data table that records each salesperson’s annual sales amount.

1. Find the years when salesperson No. 5 achieved a growth in sales amount
In Excel, first filter for data where the SELLERID is 5, and then determine whether the annual sales amount has increased each year.
Filter for data where the SELLERID is 5 and copy it out.

Determining whether there is growth is not easily achieved directly through the menu functions, so you can add a helper column to indicate the growth status and then filter again.
Add a helper column, enter the formula in cell H2:
=IF(C2>C1,1,0)
Drag the formula to get the result in the figure below, where 1 represents growth.

Filter for years with sales growth.

SPL can reference adjacent rows for filtering.
A |
|
1 |
=T("Sales_year.csv").select(SELLERID==5) |
2 |
=A1.select(AMOUNT>AMOUNT[-1]) |
3 |
=A2.to(2,) |
SPL is a programming language, but its code looks similar to Excel’s. It also writes formula in cell and can reference cell value.
A1: Read the data and select the records where SELLERID is 5.
SPL is highly interactive, allowing for viewing the results of each step in real time. For example, clicking on cell A1 can display its data on the right side of the interface.

SPL can execute all code at once, or it can execute the code in each cell step-by-step. The results of executed code can be viewed in the right-side interface.
A2: Select the years where sales amount increased, that is, where the current row’s AMOUNT is greater than the previous row’s AMOUNT. Here, you can use [-1] to reference the previous row.

A3: Remove the first row.
2. Calculate the year intervals in which salesperson No. 3 achieved consecutive sales growth
To extract consecutive growth intervals in Excel, two helper columns need to be added. One represents the number of consecutive growth rows, and the other represents the length of each growth interval.
First, filter for the sales data of salesperson with SELLERID=3.

Add a helper column named UP, and enter the function formula in cell H2:
=IF(C2>C1,H1+1,1), drag the formula.

Add a helper column named UP_len, and enter the formula in cell I2:
=IF(C3>C2,I3,H2), drag the formula.

Filter for data with UP_len greater than 2, which represents the intervals of consecutive sales growth.

Of course, Excel offers alternative methods for accomplishing this task, but they are all relatively complex to implement.
SPL, in contrast, is much easier.
In SPL, there’s a grouping function group(), which can directly group consecutive growth intervals.
A |
|
1 |
=T("Sales_year.csv").select(SELLERID==3) |
2 |
=A1.group@i(AMOUNT<=AMOUNT[-1]) |
3 |
=A2.select(~.len()>2).conj() |
A1: Read the data and select the records where SELLERID is 3.
A2: group() is a grouping function, and @i is a grouping method. group@i() means that when the expression inside the parentheses, AMOUNT<=AMOUNT[-1], is true, a new group is created. That is, when the sales amount decreases, a new group starts. In this way, consecutive increasing sales data is grouped together. The result is shown in the figure below, where the data is divided into multiple groups. By double-clicking a group, you can see the member data of that group. For example, double-clicking on group 1 will show the details of that group.

A3: Filter for groups with an interval length greater than 2, which represents the intervals of consecutive growth.
In Excel, categorization (grouping) always forces aggregation, which makes it relatively complicated to handle problems that require categorization without aggregation. SPL, on the other hand, not only has the groups() function for categorization with aggregation, but also the group() function for categorization without aggregation. The group() function is very convenient for problems like calculating consecutive growth.
The options after @ indicate the grouping method, and supporting multiple grouping methods is a major advantage of SPL’s grouping function. For example, for data in the figure below, where groups are separated by blank lines, using group@i(~[-1]==null) can conveniently group data while encountering blank lines. SPL also offers more grouping method options; for details, refer to the function reference documentation.

3. Find the list of salespeople who have achieved a top-three state sales ranking for three consecutive years
This problem is a bit complex; you first need to find the top 3 salespeople in each state for each year, and then determine if the years in which they achieved a top 3 ranking were consecutive.
Sorting by year, state and sales amount to obtain sales ranking data for each state each year is not difficult in Excel. However, extracting the top 3 from each year becomes somewhat troublesome; you would either have to manually copy and extract the data, or add a helper column to mark the ranking and then filter again.

After obtaining the top 3 salespeople for each state each year, finding the salespeople who have been in the top 3 for three consecutive years would require even more tedious steps in Excel, which will not be elaborated upon here.

SPL’s group() can retain grouped subsets, making this problem easy to solve.
A |
|
1 |
=T("Sales_year.csv") |
2 |
=A1.group(YEAR,STATE).(~.top(-3;AMOUNT)).conj() |
3 |
=A2.group(SELLERID) |
4 |
=A3.(~.group@i(YEAR-YEAR[-1]!=1).select(~.len()>=3)) |
5 |
=A4.conj().new(STATE,SELLERID,NAME) |
A2: Group by year and state, extract the top 3 from each state for each year, and then merge them.
A3: Group by SELLERID and retain each grouped subset, as shown in the left figure. Double-clicking on each subset can view the data within each group. As shown in the figure on the right, this represents the years in which salesperson No. 1 ranked in the top 3.

A4: For each salesperson’s subset, group the consecutive years within the subset, and then select the data with a consecutive year count >=3. After two grouping operations, the result is a three-level dataset. The first level is the data for each salesperson who has been in the top 3, with one salesperson per group, as shown in the left figure; the second level is the consecutive years a salesperson has been in the top 3, and it selects groups with consecutive years >=3, as shown in the middle figure for salesperson #1, showing groups of 3+ consecutive years in the top 3; and the third level is the details within each group, as shown in the right figure. The hierarchical data result display allows you to clearly understand the outcome of each line of code.

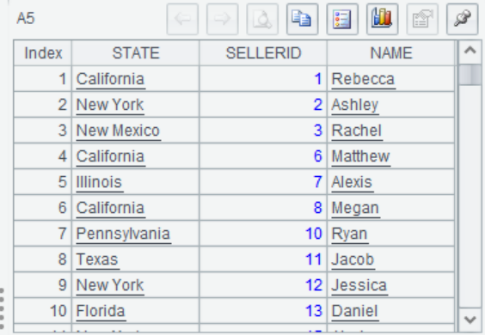
A5: Extract the names of salespeople who meet the criteria. Because it is difficult to extract the three-level result, first use the conj() function to union the result into a two-level structure as shown in the figure below, and then use the new function to extract the corresponding salesperson name and state from each group member, which produces the desired list.


Once you’re proficient, you can combine conj into the previous operations, which will make the code simpler:
A |
|
1 |
=T("Sales_year.csv") |
2 |
=A1.group(YEAR,STATE).conj(~.top(-3;AMOUNT)) |
3 |
=A2.group(SELLERID) |
4 |
=A3.conj(~.group@i(YEAR-YEAR[-1]!=1).select(~.len()>=3)) |
5 |
A4.new(STATE,SELLERID,NAME) |
SPL Official Website 👉 https://www.scudata.com
SPL Feedback and Help 👉 https://www.reddit.com/r/esProcSPL
SPL Learning Material 👉 https://c.scudata.com
SPL Source Code and Package 👉 https://github.com/SPLWare/esProc
Discord 👉 https://discord.gg/2bkGwqTj
Youtube 👉 https://www.youtube.com/@esProc_SPL


