Solve some difficult problems in reporting tools such as Birt
In article 《How to implement irregular month statistics in Birt》, we explained how to help Birt produce the report in detail. In this article, we will continue to discuss several similar problems in Birt, and focus on how to write an esProc SPL script, rather than repeating the steps of how to introduce SPL into Birt.
1. Intra-group cross-row computation
Cross-row calculation within a group refers to that the data of other rows in the group need to be referenced when calculating the value of a computed column in a row. For example:
The database table sample has three fields, in which id is a grouping field. We need to design a grouping table, using id for the grouping, detailed fields are v1, V2 and calculation column crossline, in which the algorithm of crossline is the sum of v1, v2 of the current record plus the sum of v1 and v2 of the last record in the same group. The sample source data is as follows:
| id | v1 | v2 |
|---|---|---|
| 1 | 1 | 2 |
| 1 | 2 | 3 |
| 2 | 1 | 1 |
| 2 | 2 | 2 |
| 3 | 3 | 3 |
The final report results to be presented are as follows:

The esProc SPL codes are as follows:
| A | |
|---|---|
| 1 | =connect("demo") |
| 2 | =A1.query("select *, 0 as crossline from sample") |
| 3 | >A2.group(id).run(~.run(v1+v2+v1[-1]+v2[-1]:crossline)) |
| 4 | >A1.close() |
| 5 | return A2 |
A1 Connect the database.
A2 Query the database and produce a column of constant for backup.
A3 Group by id, modify the value of crossline in each group, and finally merge, where v1[-1], v2[-1] is the unique expression in esProc to locate the fields of the last row of record.
A4 Close the database.
A5 Return the computing result dataset in A2 to the reporting tool.
2. Cross-database data sources
The data for the producing of a report often comes from many kinds of data sources, such as different databases, text files, Excel files, etc. These data often need to be joined and calculated in the report.
Reporting tool itself can extract data from multiple data sources, but it will be difficult to do the joins, or its performance is very poor. The workload is usually very large when the developer programs to do the joins by himself. The esProc SPL can help a lot in this respect.
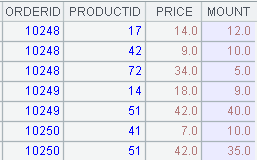
In the following example, the data of table orders and table orderDetail comes from two different databases, and join operation is performed between them. The data in the two tables is as follows:


The report results we want to present are as follows:

The esProc SPL codes are as follows:
| A | |
|---|---|
| 1 | =connect("db1") |
| 2 | =connect("db2") |
| 3 | =A1.query("select orderID,customer,orderDate from orders") |
| 4 | =A2.query("select orderID,productID,price,mount from orderDetail order by orderID") |
| 5 | >A1.close() |
| 6 | >A2.close() |
| 7 | =join@1(A3:orderID,A4:orderID) |
| 8 | =A7.new(#1.orderID,#1.customer,#1.orderDate,#2.productID,#2.price,#2.mount) |
| 9 | return A8 |
A1 Connect database 1.
A2 Connect database 2.
A3 Query data from table orders.
A4 Query data from table orderDetail.
A5,A6 Close the database connection.
A7 The orderID of A3 and the orderID of A4 are used as the main keys for left join. The result set after join has two fields, the first field is the records of A3 and the second field is the records of A4.
A8 Form a new dataset with the fields of two fields in A7, which is the result needed.
A9 Return the dataset in A8 to the reporting tool.
This example only demonstrates the left join of two data sources. In fact, SPL can perform any data operations that relational databases can complete, such as various join, union, filtering, grouping, sorting, etc.
3. Splitting field into records
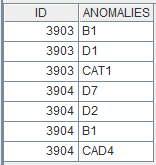
In this example, the database table data has two fields, in which the ANOMOALIES field is multiple strings separated by spaces. We need to split ANOMOALIES into multiple strings by spaces and form new records with each string and the original ID field. The source data is as follows:
| ID | ANOMALIES |
|---|---|
| 3903 | B1 D1 CAT1 |
| 3904 | D7 D2 B1 CAD4 |
The report results we want to present are as follows:

The esProc SPL codes are as follows:
| A | |
|---|---|
| 1 | =connect("db") |
| 2 | =A1.query("select ID,ANOMALIES from data") |
| 3 | =A2.conj(ANOMALIES.array(" ").new(A2.ID:ID,~:ANOMALIES)) |
| 4 | >A1.close() |
| 5 | return A3 |
A1 Connect database 1.
A2 Query data of table data.
A3 Split ANOMALIES field values by spaces and form new records with the original ID.
A4 Close the database connection.
A5 Return the dataset in A3 to the reporting tool.
4. Dynamic insertion of sub-table fields in the main table
In this example, the database table dColThread is the main table and the main key is tID. dColQuestion is a sub-table and the foreign key is tID, as follows:
dColThread
| tID | ApplicationName | User | Phone | Decline |
|---|---|---|---|---|
| A01 | mfc | Bill | +70000000 | 1 |
| A02 | mfc | John | +18761221 | 2 |
| A03 | java | Jack | +8014001231 | 6 |
| A04 | mfc | Tim | +008613133123 | 4 |
| A05 | db | John | +18761221 | 8 |
dColQuestion
| qID | tID | status |
|---|---|---|
| 1 | A01 | yes |
| 2 | A01 | no |
| 3 | A01 | yes |
| 4 | A02 | yes |
| 5 | A03 | no |
| 6 | A04 | no |
| 7 | A04 | no |
| 8 | A05 | yes |
The report needs to query the main table according to ApplicationName and present the data as a list. As you can see, in the sub-table, there are no more than five status field values corresponding to each record in the main table. We need to arrange these records in the sub-table horizontally and insert them into the Phone and Decline fields of the main table, named QuestionNo1, QuestionNo2, … QuestionNo5. At the same time, if a column of data is empty, the column is not displayed. The expected table is as follows:
Prepare data using esProc, and the SPL codes are as follows:
| A | B | |
|---|---|---|
| 1 | =connect("db") | |
| 2 | =A1. query("select * from dColThread t,dColQuestion q where t.tID=q.tID and t.ApplicationName=?",arg1) | |
| 3 | >A1.close() | |
| 4 | =A2.group(tID) | |
| 5 | =create(ApplicationName,User,Phone,QuestionNo1,QuestionNo2,QuestionNo3,QuestionNo4,QuestionNo5,Decline) | |
| 6 | for A4 | =A6.(status)|["","","","",""] |
| 7 | = A5.record(A6.ApplicationName|A6.User|A6.Phone|B6.to(5)|A6.Decline) | |
| 8 | return A5 | |
A1 Connect the database.
A2 Execute SQL to retrieve the associated data from the main table and sub-table. Arg1 is the parameter of the report. If arg1= “mfc”, then A2’s calculation results are as follows:

A4 Group according to tID. Each group contains a main table record and the corresponding sub-table records, as follows:

A5 Create a new empty two-dimensional table according to the table structure in the report.
A6 Loop the group in A4, and insert a record to A5 at a time. In the loop body, you can use A6 to refer to loop variables, and #A6 to refer to loop counting.
B6 Take the status field value in the current group and fill in at least five records.
B7 Add new records to A5. At the end of the loop, A5 is as follows:

A8 Return the result to the report.
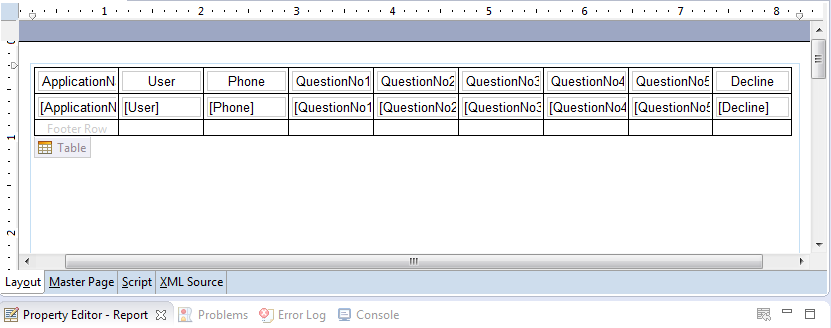
Leave the work of hiding empty columns to Birt. Design table list, and the template is as follows:

If the QuestionNo column is empty, then it should be hidden. There are many methods of dynamic hiding columns, one of which is introduced here. For QuestionNo5 (similar to other columns), you can first use the following script in the onFetch method of dataSet:
    if(reportContext.getGlobalVariable("t5")==null){
        reportContext.setGlobalVariable("t5",row.QuestionNo5)
    }else{
        reportContext.setGlobalVariable("t5",reportContext.getGlobalVariable("t5")+row.QuestionNo5)
    }
Then use the following expression in the Visibility attribute of the QustionNo5 column:
BirtStr.trim(reportContext.getGlobalVariable("t5"))==""
You can see the report results after preview:

5. Summary
Through the above examples, we can see that when making reports, we often encounter difficult data preparation work, which can be perfectly solved with the help of esProc. This is because esProc provides a complete data source connection function, which can connect various data sources which are common in the market. SPL also provides a rich library of functions, which can easily perform various data join operations outside the database.
SPL Official Website 👉 https://www.scudata.com
SPL Feedback and Help 👉 https://www.reddit.com/r/esProcSPL
SPL Learning Material 👉 https://c.scudata.com
SPL Source Code and Package 👉 https://github.com/SPLWare/esProc
Discord 👉 https://discord.gg/2bkGwqTj
Youtube 👉 https://www.youtube.com/@esProc_SPL


