

ROC curve
In the binary classification model (also known as classifier), for the definition of positive and negative examples, a threshold value is usually set. If the value is greater than the threshold value, it is a positive class, and if the value is less than the threshold value, it is a negative class. If we reduce the threshold value, more samples will be identified as positive class, and the recognition rate of positive class will be improved, but at the same time, more negative classes will be identified as positive class by mistake.
In order to express this phenomenon intuitively, ROC is introduced. According to the classification results, the corresponding points in ROC space are calculated, and the ROC curve is formed by connecting these points.
The horizontal coordinate of ROC curve is "1-sensitivity" and the vertical coordinate is "sensitivity".
The formulas for calculating Sensitivity and Specificity are shown in section 1 of this chapter: Accuracy, Precision, Recall, Specificity, F1 (raqsoft.com)
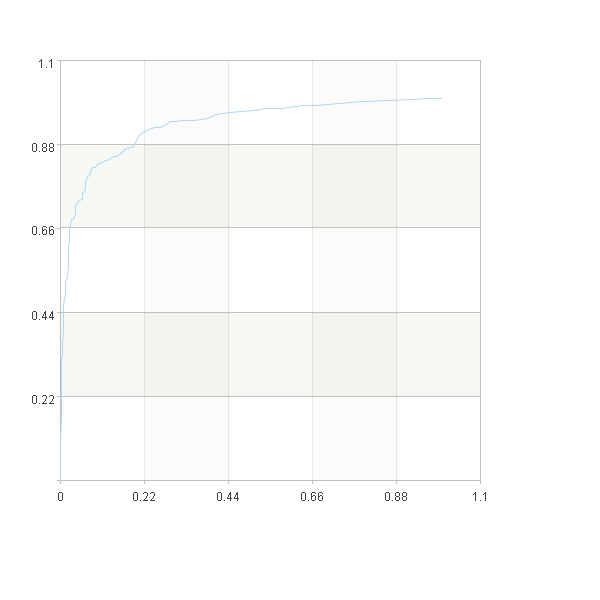
For example, draw the ROC curve for “titanic_export.csv” as the result of the Titanic prediction
A |
B |
C |
|
1 |
=T("D://titanic_export.csv") |
||
2 |
for 0,100 |
=A2/100 |
|
3 |
=A1.select(Survived==1 && Survived_1_percentage>=B2) |
||
4 |
=A1.select(Survived==0 && Survived_1_percentage>=B2) |
||
5 |
=A1.select(Survived==1 && Survived_1_percentage<B2) |
||
6 |
=A1.select(Survived==0 && Survived_1_percentage<B2) |
||
7 |
>TP=B3.len(),FP=B4.len(),FN=B5.len(),TN=B6.len(),N=A1.len() |
||
8 |
=TP/(TP+FN) |
/Sensitivity |
|
9 |
=1-TN/(FP+TN) |
/1-Specificity |
|
10 |
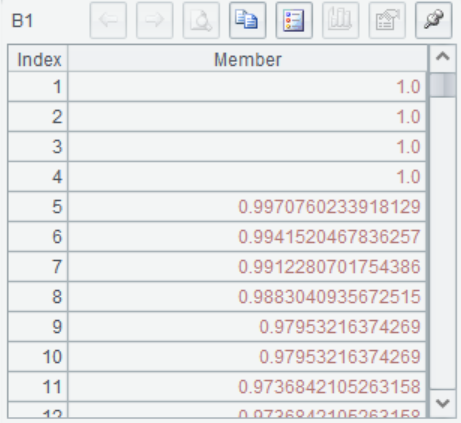
>B1=B1|B8 |
||
11 |
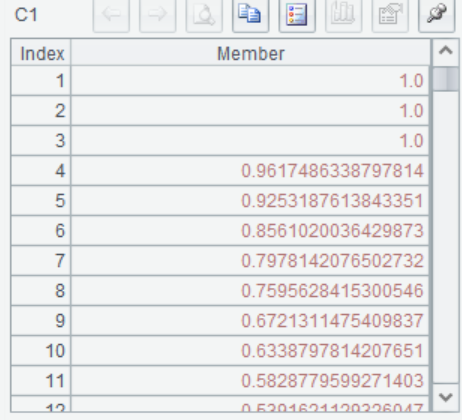
>C1=C1|B9 |
||
12 |
=canvas() |
||
13 |
=A12.plot("NumericAxis","name":"x") |
||
14 |
=A12.plot("NumericAxis","name":"y","location":2) |
||
15 |
=A12.plot("line","markerStyle":0,"axis1":"x","data1":C1,"axis2":"y", "data2":B1) |
||
16 |
=A12.draw@p(600,600) |
A2-B11 A total of 100 thresholds were selected, and the Sensitivity and 1-Specificity for each threshold were calculated iteratively, and the results were stored in B1 and C1 as Y-axis and X-axis data, respectively
A12-A16 Select Y-axis and X-axis data and draw the ROC diagram
SPL Official Website 👉 https://www.scudata.com
SPL Feedback and Help 👉 https://www.reddit.com/r/esProcSPL
SPL Learning Material 👉 https://c.scudata.com
SPL Source Code and Package 👉 https://github.com/SPLWare/esProc
Discord 👉 https://discord.gg/2bkGwqTj
Youtube 👉 https://www.youtube.com/@esProc_SPL

