

ReportLite practice: cross report involving self-defined grouping interval
When making reports, there is often a need to summarize data by self-defined statistical intervals such as time period, numerical range. For example, we may need to count the number of employees in different age groups by department based on employee data. The employee data is stored in an xls file:

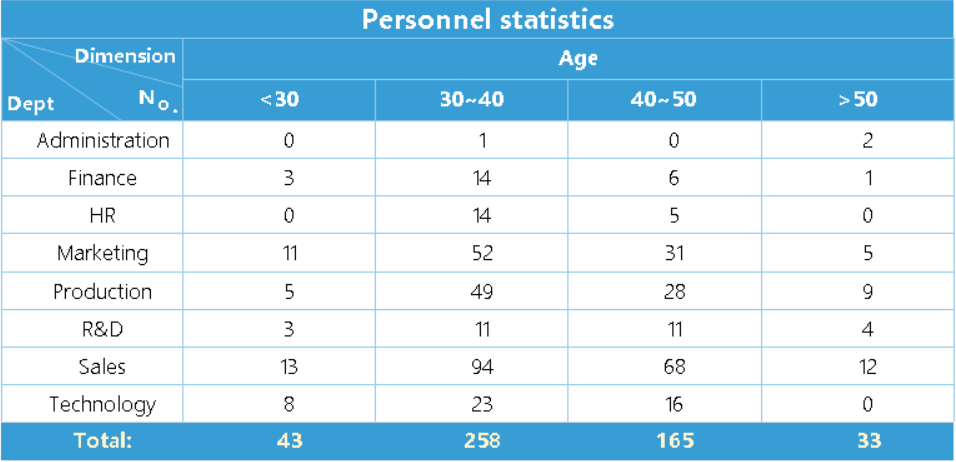
We want to achieve the following result:
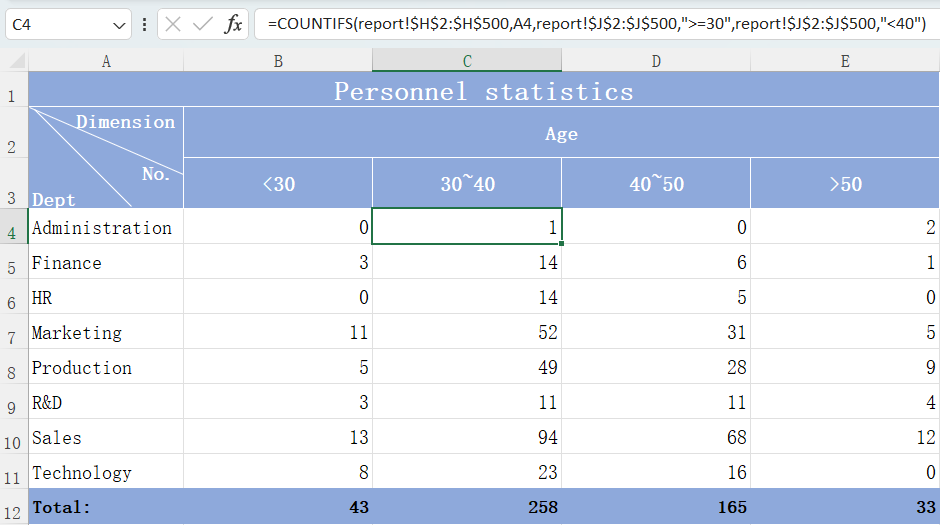
In Excel, we can use the COUNTIFS function to implement conditional aggregation, such as the formula in C4: =COUNTIFS(report!$H$2:$H$500,A4,report!$J$2:$J$500,“>=30”,report!$J$2:$J$500,“<40”). However, since what the original data stores is the birth dates, and we need to count by age group here, it needs to add one column J to calculate the ages, and we have to write similar formulas in the corresponding cells for each age group, which is a bit troublesome. Moreover, once the age group interval changes, we need to adjust these formulas, resulting in a lot of repetitive work.
Using ReportLite to make the report is very easy. The direct use of its own functions allows us to flexibly set the statistical interval, then we just need to set the report template.
Report making
Select the source data file, and name it as ds1 dataset in the report as usual.

Report template:
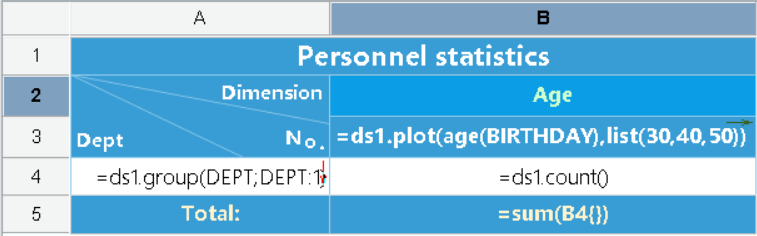
This report is a bi-directional stretch cross report.
A4: =ds1.group(DEPT;DEPT:1) means to retrieve the data of DEPT column from ds1 and group the data by DEPT, and the calculation of the cell to the right of it will be limited to the corresponding group in ds1. By default, this cell is stretched vertically based on the data, and the red arrow on the right indicates the stretch direction, which can be changed through the ‘Expanding Mode’ property.
B3: =ds1.plot(age(BIRTHDAY),list(30,40,50)). The data in BIRTHDAY column is the birth date. Use the age function to convert them to age. List(30,40,50) sets the age group interval. Then, set the “Expanding Mode” property of cell B3 to “Horizontal” in the property bar on the right. When previewing the report, A4 will stretch vertically and B3 will stretch horizontally, achieving a bi-direction stretch effect.
B4: =ds1.count() means to count and summarize the data of intersection area.
B5: =SUM(B4{}) means to calculate the sum of data within the current age group.
Finally, adjust the report format, including the cell merging, header slash setting, cell font color setting, color filling, data format setting, etc.
Preview the result:
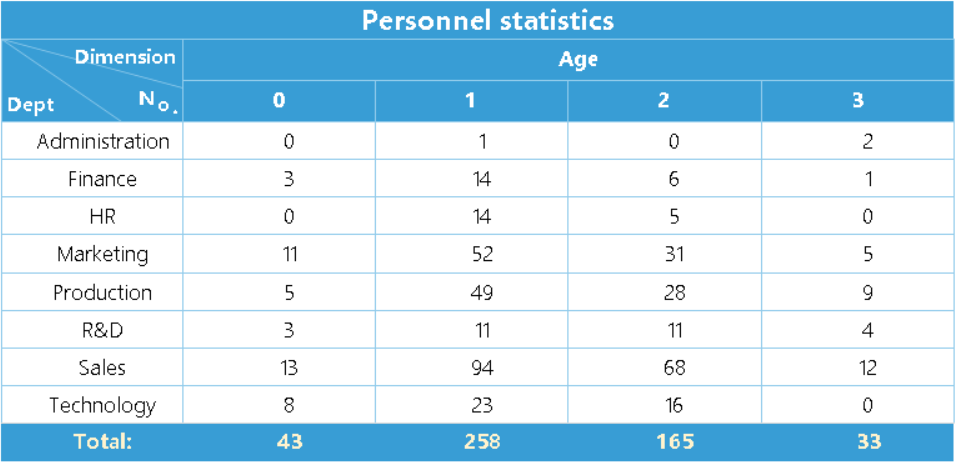
It can be seen that 0, 1, 2, and 3 are displayed in B3. Because the plot function will display the segment number corresponding to the data, we need to convert them to the expected text. In the Exp column of “Display Value” property of cell B3, write the formula: map(to(0,3),list(“<30”,“30~40”,“40~50”,“>50”)), and then preview:
Now the report can be saved as a XLS file.
This kind of report involving self-defined grouping interval can be made by only writing the formula in one cell, which is very convenient, as the cell will automatically stretch according to the settings. When the age group interval is changed, it just needs to modify the formula in this cell.
Download ReportLite and more at http://www.raqsoft.com/reportlite.
SPL Official Website 👉 https://www.scudata.com
SPL Feedback and Help 👉 https://www.reddit.com/r/esProcSPL
SPL Learning Material 👉 https://c.scudata.com
SPL Source Code and Package 👉 https://github.com/SPLWare/esProc
Discord 👉 https://discord.gg/2bkGwqTj
Youtube 👉 https://www.youtube.com/@esProc_SPL


Chinese version