Solve some difficult problems in reporting tools such as Jasper
When making reports, we often encounter some problems which are difficult to solve by relying solely on reporting tools. This article will introduce how to use esProc SPL language to solve the practical problems raised by several Jasper reporting tool users in foreign forums. The solution here is not only applicable to Jasper, but also to other reporting tools.
1. Calculating the account balance of each period
The data file data.csv stores the deposit and withdrawal of funds in each period of an account. When the initial balance of the account is known to be 43, we need to calculate the balance of each period according to the data file. A part of the source data is as follows:
| Inputs,Outputs 0,10 15,0 22,0 0,33 0,15 0,14 36,0 0,69 2,0 18,0 |
The desired report result is as follows:
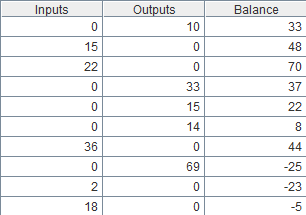
When calculating the balance of each period according to the amount of deposit and withdrawal, cross-row calculation is needed, which can be realized by Jasper. However, the implementation steps are complex and difficult. With the help of esProc, it can be easily implemented. The detailed esProc SPL codes are as follows:
| A | |
|---|---|
| 1 | =file("data.csv").import@tc() |
| 2 | return (t=43,A1.derive(t=t+Inputs-Outputs:Balance)) |
A1 Import the file, option @tc indicates that the file has a title line and is separated by a comma.
A2 Calculate the balance of each period and return the result to the report. Set the account initial value to 43, and add a column to A1 table, whose value is “the balance of the previous period + current Inputs-current Outputs”. Obviously, the result here is what we want the report to present.
Save the above SPL codes to file balance.dfx.
To present the result in report, we can use the JDBC interface that esProc provided. The report calls the esProc the same way it calls the stored procedure. Call balance() can be used to call and pass in parameters in Jasper’s SQL Designer. For detailed procedure, please refer to《How to call an SPL script in JasperReport》.
Then, design the simple list table in Jasper with the following template:
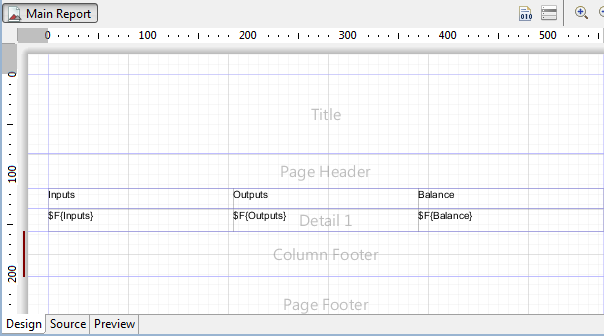
After preview, you can see the result of the report, as we requested.:

2. Calculating loan instalments
Database table loan stores loan information, including loan amount, number of terms in months, and annual interest rate. Now we need to create a table, in which details of each term are listed under each loan information, incl. current repayment, current interest, current principal and principal balance.
Part of the table loan data is as follows:
| LoanID | LoanAmt | Term | Rate |
|---|---|---|---|
| L01 | 100000 | 5 | 4.75 |
| L02 | 20000 | 2 | 5 |
| L03 | 500000 | 12 | 4.5 |
The desired report result is as follows:
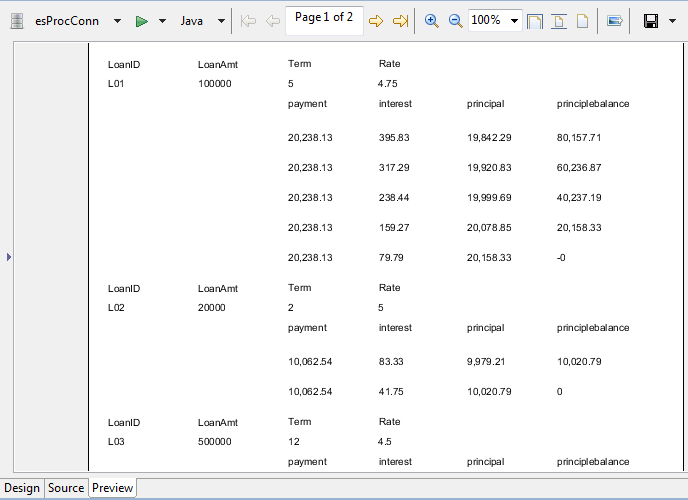
When calculating loan instalment according to loan amount, loop calculation and cross-row calculation are needed. It is difficult to implement it with stored procedures or scriptlets, but it’s easy to implement in Jasper with the help of esProc. The esProc codes are as follows:
| A | |
|---|---|
| 1 | =db.query("select * from loan") |
| 2 | =A1.derive(Rate/100/12:mRate,LoanAmt*mRate*power((1+mRate),Term)/(power((1+mRate),Term)-1):mPayment) |
| 3 | =A2.((t=LoanAmt,Term.new(A2.LoanID:LoanID, A2.LoanAmt:LoanAmt, A2.mPayment:payment, A2.Term:Term,A2.Rate:Rate, t*A2.mRate:interest, payment-interest:principal, t=t-principal:principlebalance))) |
| 4 | =A3.conj() |
| 5 | return A4 |
A1 Execute SQL, extract the records from loan.
A2 Add two columns to table in A1, monthly interest rate mRate and monthly repayment amount mPayment, respectively. The result is as follows:

A3 Calculate the details of each term according to the loan information. A2.()is a loop function, which can calculate the members of A2 in turn. The codes in “()” will be calculated step by step, and finally the result of the last comma will be returned. Function new is used to generate new two-dimensional table. The calculation result of A3 is layered data, as follows:
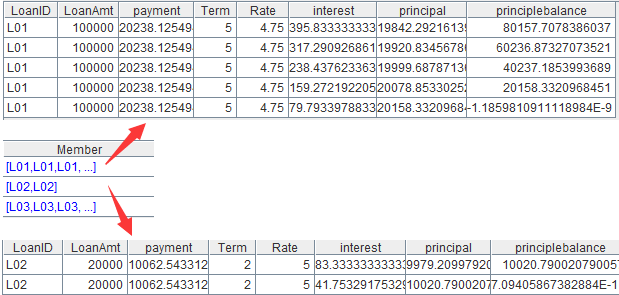
A4 Combine the layered data, and form the instalment table.
A5 Return the result to the report.
Similarly, design a simple table in Jasper, and the template is as follows:
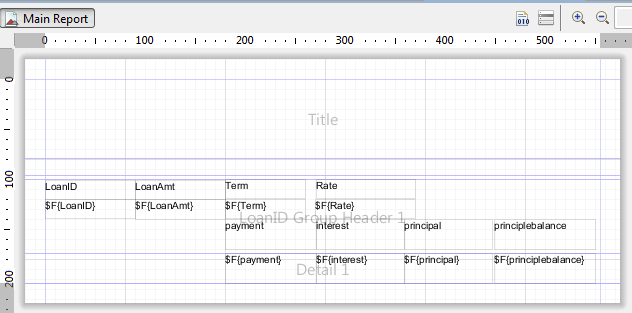
After preview, you can see the result of the report, as we requested.
3. Calculating the growth rate of the cross-table
The database table store stores the sales volume of various products in 2014 and 2015. Now we need to present the annual sales volume of each product with cross table and calculate the annual growth rate of each product. Part of the source data is as follows:
| Year item quantity 2014 Book 35 2015 Pencil 50 2014 Pencil 56 2015 Book 67 |
The desired report result is as follows:
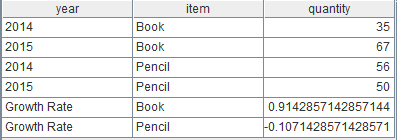
Because each column of the cross table is generated dynamically and needs dynamic reference when calculating between columns, it is difficult to implement this requirement with Jasper script, while it is much simpler to implement the corresponding calculation with esProc in the data preparation stage. The esProc codes are as follows:
| A | |
|---|---|
| 1 | =mydb.query("select * from store order by item,year") |
| 2 | =A1.group(item).run(A1.record(["Growth Rate",item,~(2).quantity/~(1).quantity-1])) |
| 3 | return A1 |
A1 Query the records of table store.
A2 Add annual growth rate of each product. Group according to the items. Run calculates each group of data in turn. Record adds a record, and ~(i) represents the number i record in the current group.
A3 Return the calculation result to the report.
Design the simple cross table in Jasper, and the template is as follows:
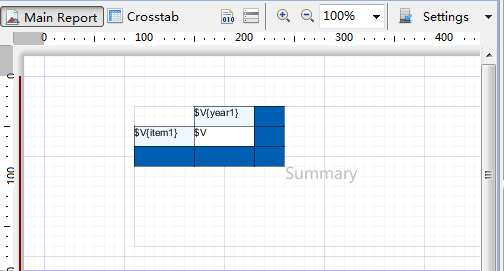
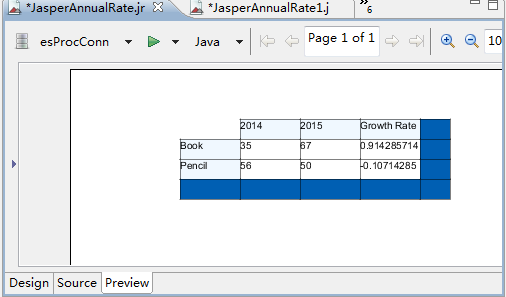
After preview we can see the report result as follows:
SPL Official Website 👉 https://www.scudata.com
SPL Feedback and Help 👉 https://www.reddit.com/r/esProcSPL
SPL Learning Material 👉 https://c.scudata.com
SPL Source Code and Package 👉 https://github.com/SPLWare/esProc
Discord 👉 https://discord.gg/2bkGwqTj
Youtube 👉 https://www.youtube.com/@esProc_SPL


