7.2 Conditional aggregation
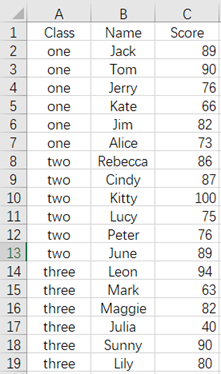
Here below is a data table:

To count the following information for each class: number of students with score above 90, the number of failed students, and the average score after removing the highest and lowest scores, the code is as follows:
=spl("=E(?1).group(Class).new(Class,~.count(Score>=90):'ScoreAbove90',~.count(Score<60):Failed,~.sort(Score).m(2:-2).avg(Score):AverageScore)", A1:C19)
where m(2:-2) represents the set of members from the second to penultimate member of a sequence.

esProc Desktop and Excel Processing
7.1 Simple column-wise aggregation
7.3 Fill aggregation value in the first row of the same group of data
SPL Official Website 👉 https://www.scudata.com
SPL Feedback and Help 👉 https://www.reddit.com/r/esProc_Desktop/
SPL Learning Material 👉 https://c.scudata.com
Discord 👉 https://discord.gg/cFTcUNs7
Youtube 👉 https://www.youtube.com/@esProcDesktop
Linkedin Group 👉 https://www.linkedin.com/groups/14419406/


