7.3 Fill aggregation value in the first row of the same group of data
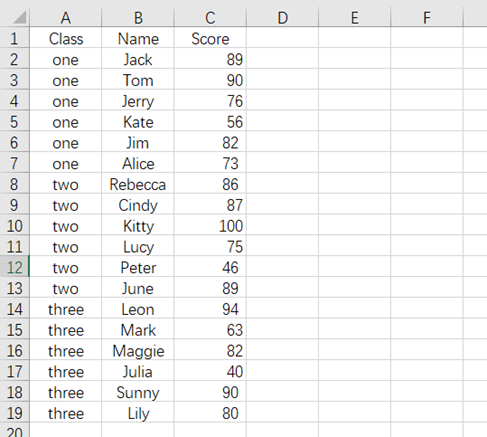
Here below is a data table:

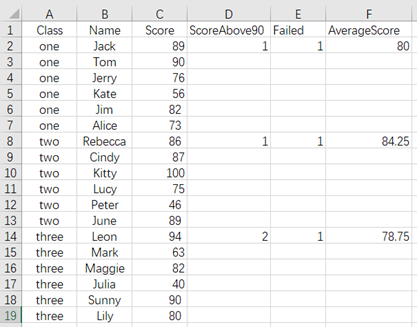
Now we want to count the following information for each class: number of students with score above 90, number of failed students, and the average score after removing the highest and lowest scores, and then fill the results in the first row of each class (calculate in cell D1):
| A | |
|---|---|
| 1 | =E(‘A1:C19’).derive(:ScoreAbove90,:Failed,:AverageScore) |
| 2 | =A1.group(Class).run(~(1).ScoreAbove90=~.select(Score>=90).len(),~(1).Failed=~.select(Score<60).len(),~(1).AverageScore=~.sort(Score).m(2:-2).avg(Score)) |
| 3 | return A1.new(ScoreAbove90,Failed,AverageScore) |

esProc Desktop and Excel Processing
7.2 Conditional aggregation
7.4 Split aggregation value and fill them in detail rows
SPL Official Website 👉 https://www.scudata.com
SPL Feedback and Help 👉 https://www.reddit.com/r/esProc_Desktop/
SPL Learning Material 👉 https://c.scudata.com
Discord 👉 https://discord.gg/cFTcUNs7
Youtube 👉 https://www.youtube.com/@esProcDesktop
Linkedin Group 👉 https://www.linkedin.com/groups/14419406/


